Service Map in the Context of Kubernetes
Kubeshark provides a comprehensive understanding of the complex network of interactions inside your cluster. You can toggle between pod and namespace perspectives and monitor latency, bandwidth, and throughput for pods, nodes, and namespaces.
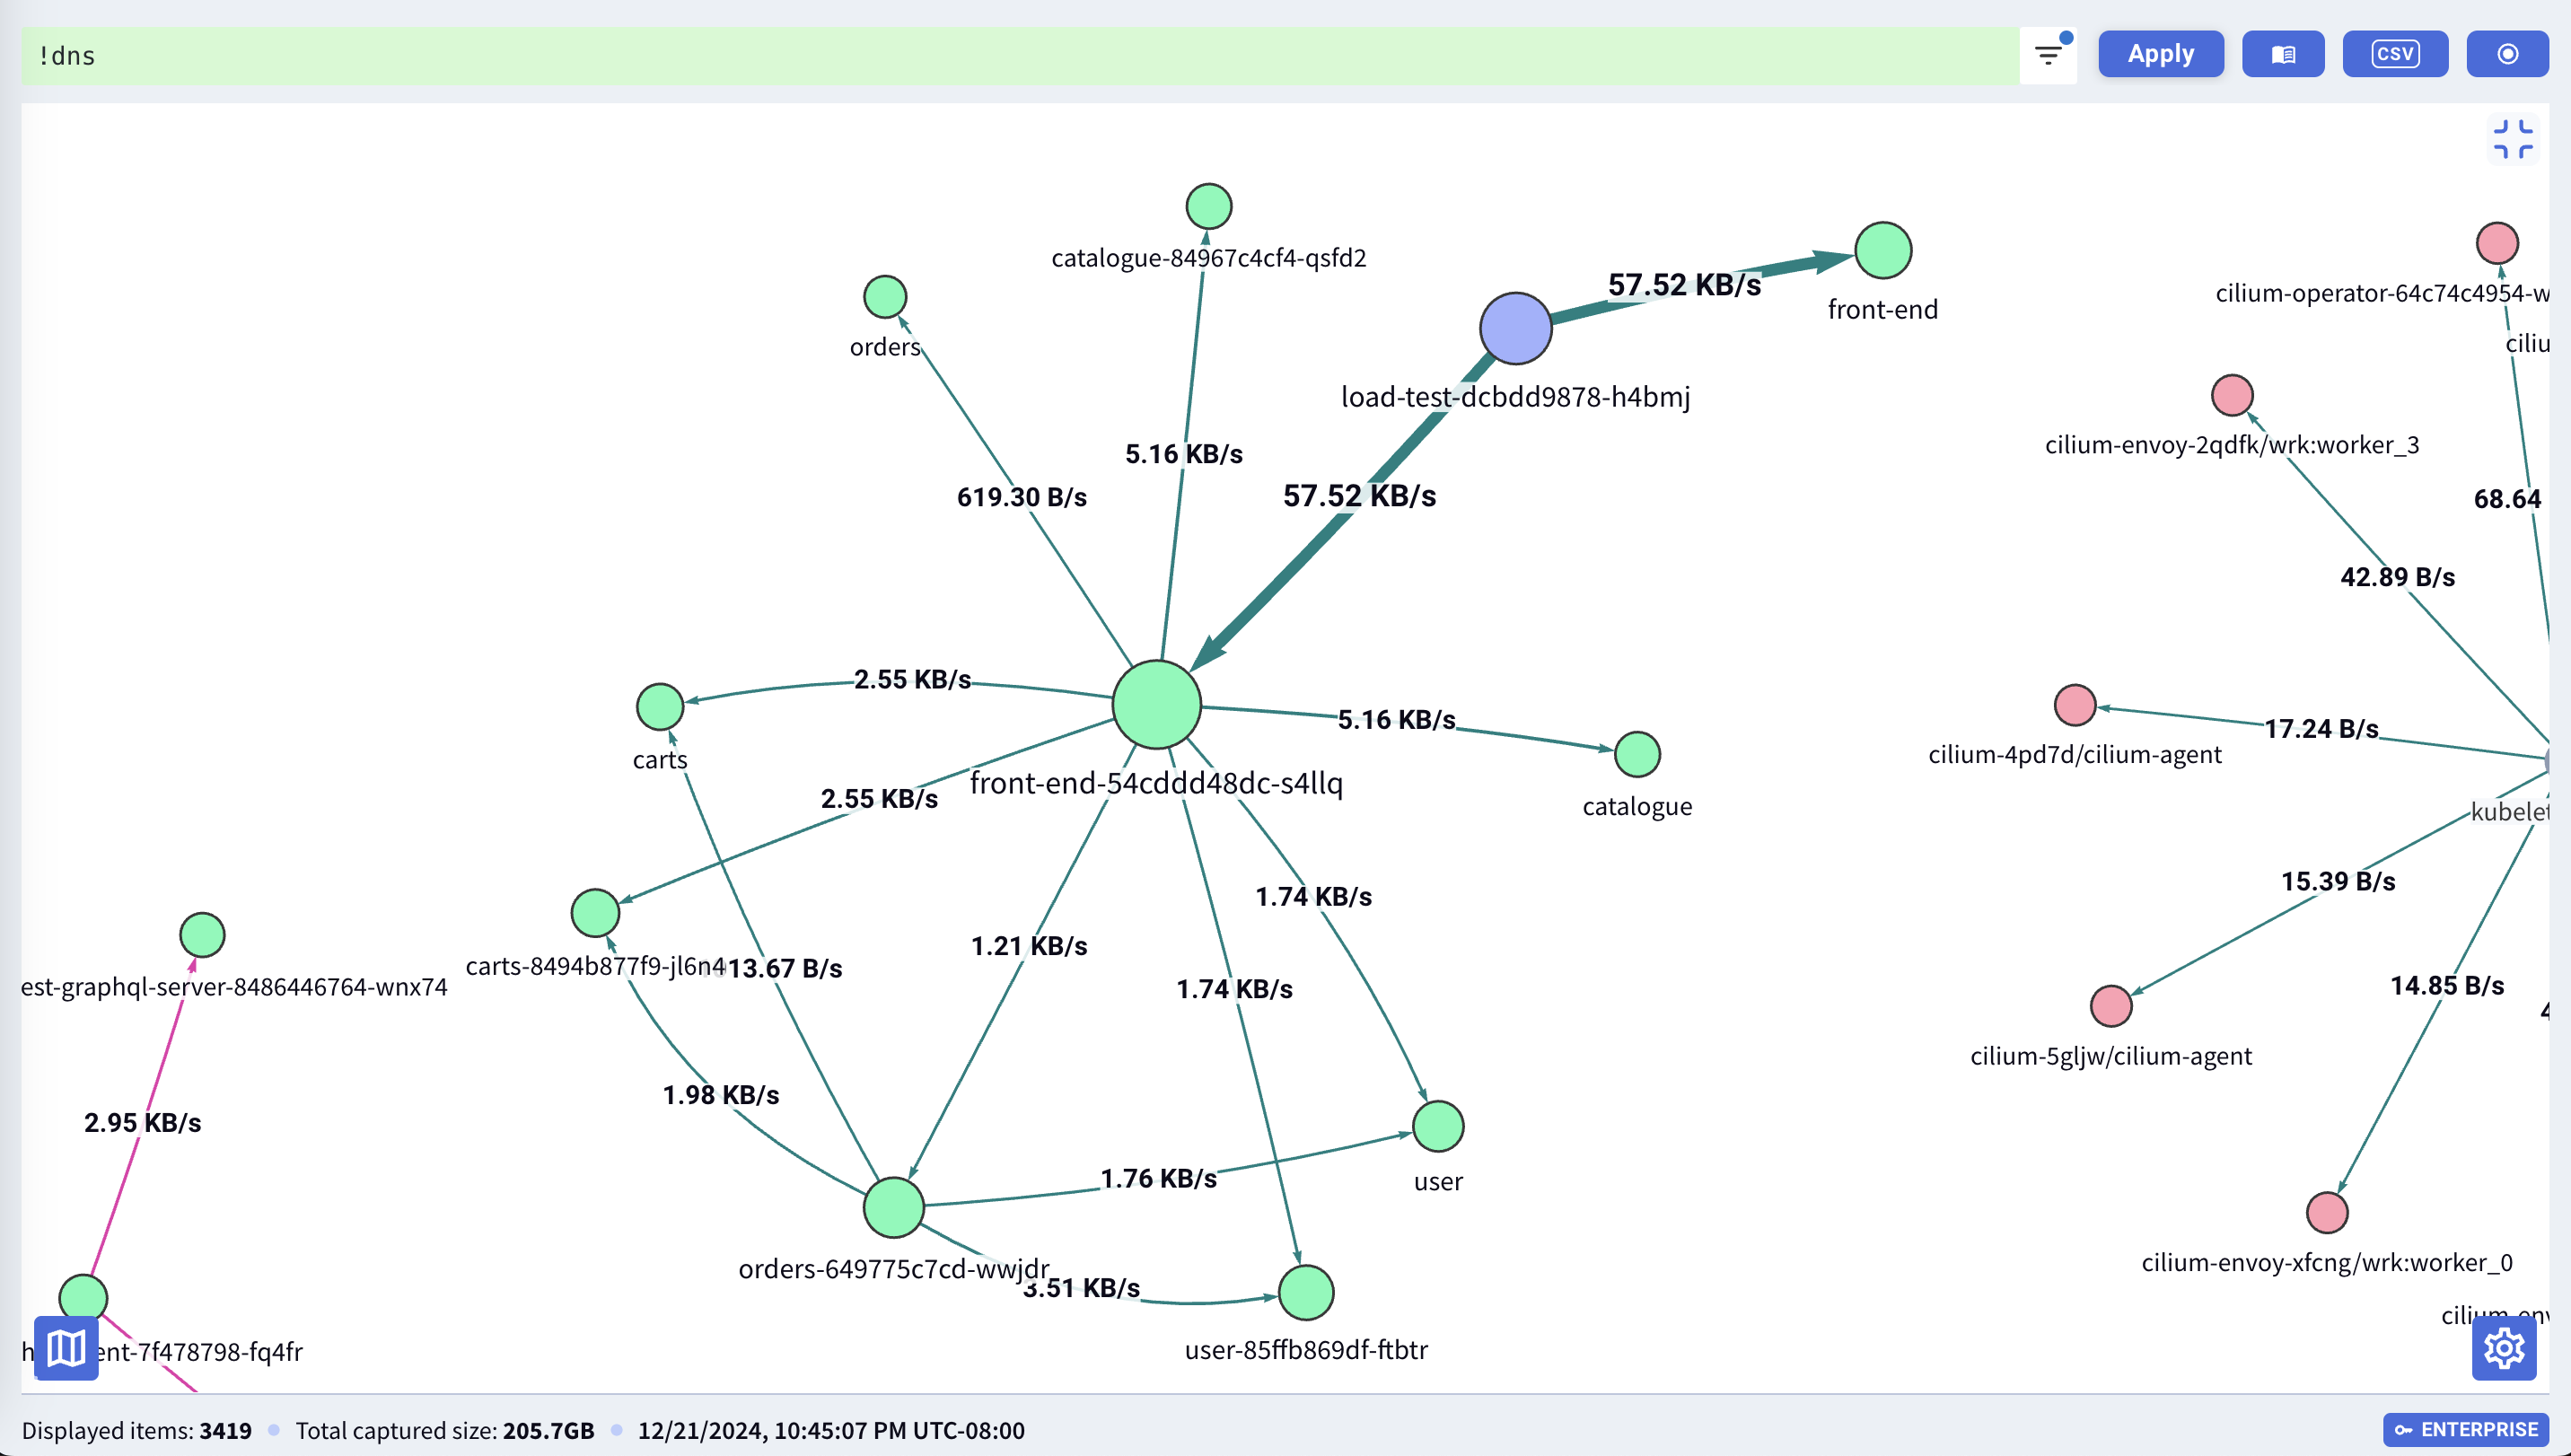
The Service Map displays the following data in a visual graph:
- Multiple identity layers such as namespaces, pod names, service names for internal workloads, and DNS identities for external workloads.
- Key Performance Indicators (KPIs) like latency, throughput, and bandwidth.
- Service connectivity details including protocol, direction, and density.
To access the Service Map, click its button located in the upper right corner.
Focus on Specific Parts of the Cluster
Dense clusters can yield cluttered Service Maps. With Kubeshark, you can zero in on particular sections of your cluster by pairing it with a KFL filter, narrowing down your analysis to specific segments of your cluster’s traffic.
View Real-Time Changes
By default, the Service Map refreshes in real-time, displaying changes inferred directly from incoming traffic.