Anatomy of Kubeshark
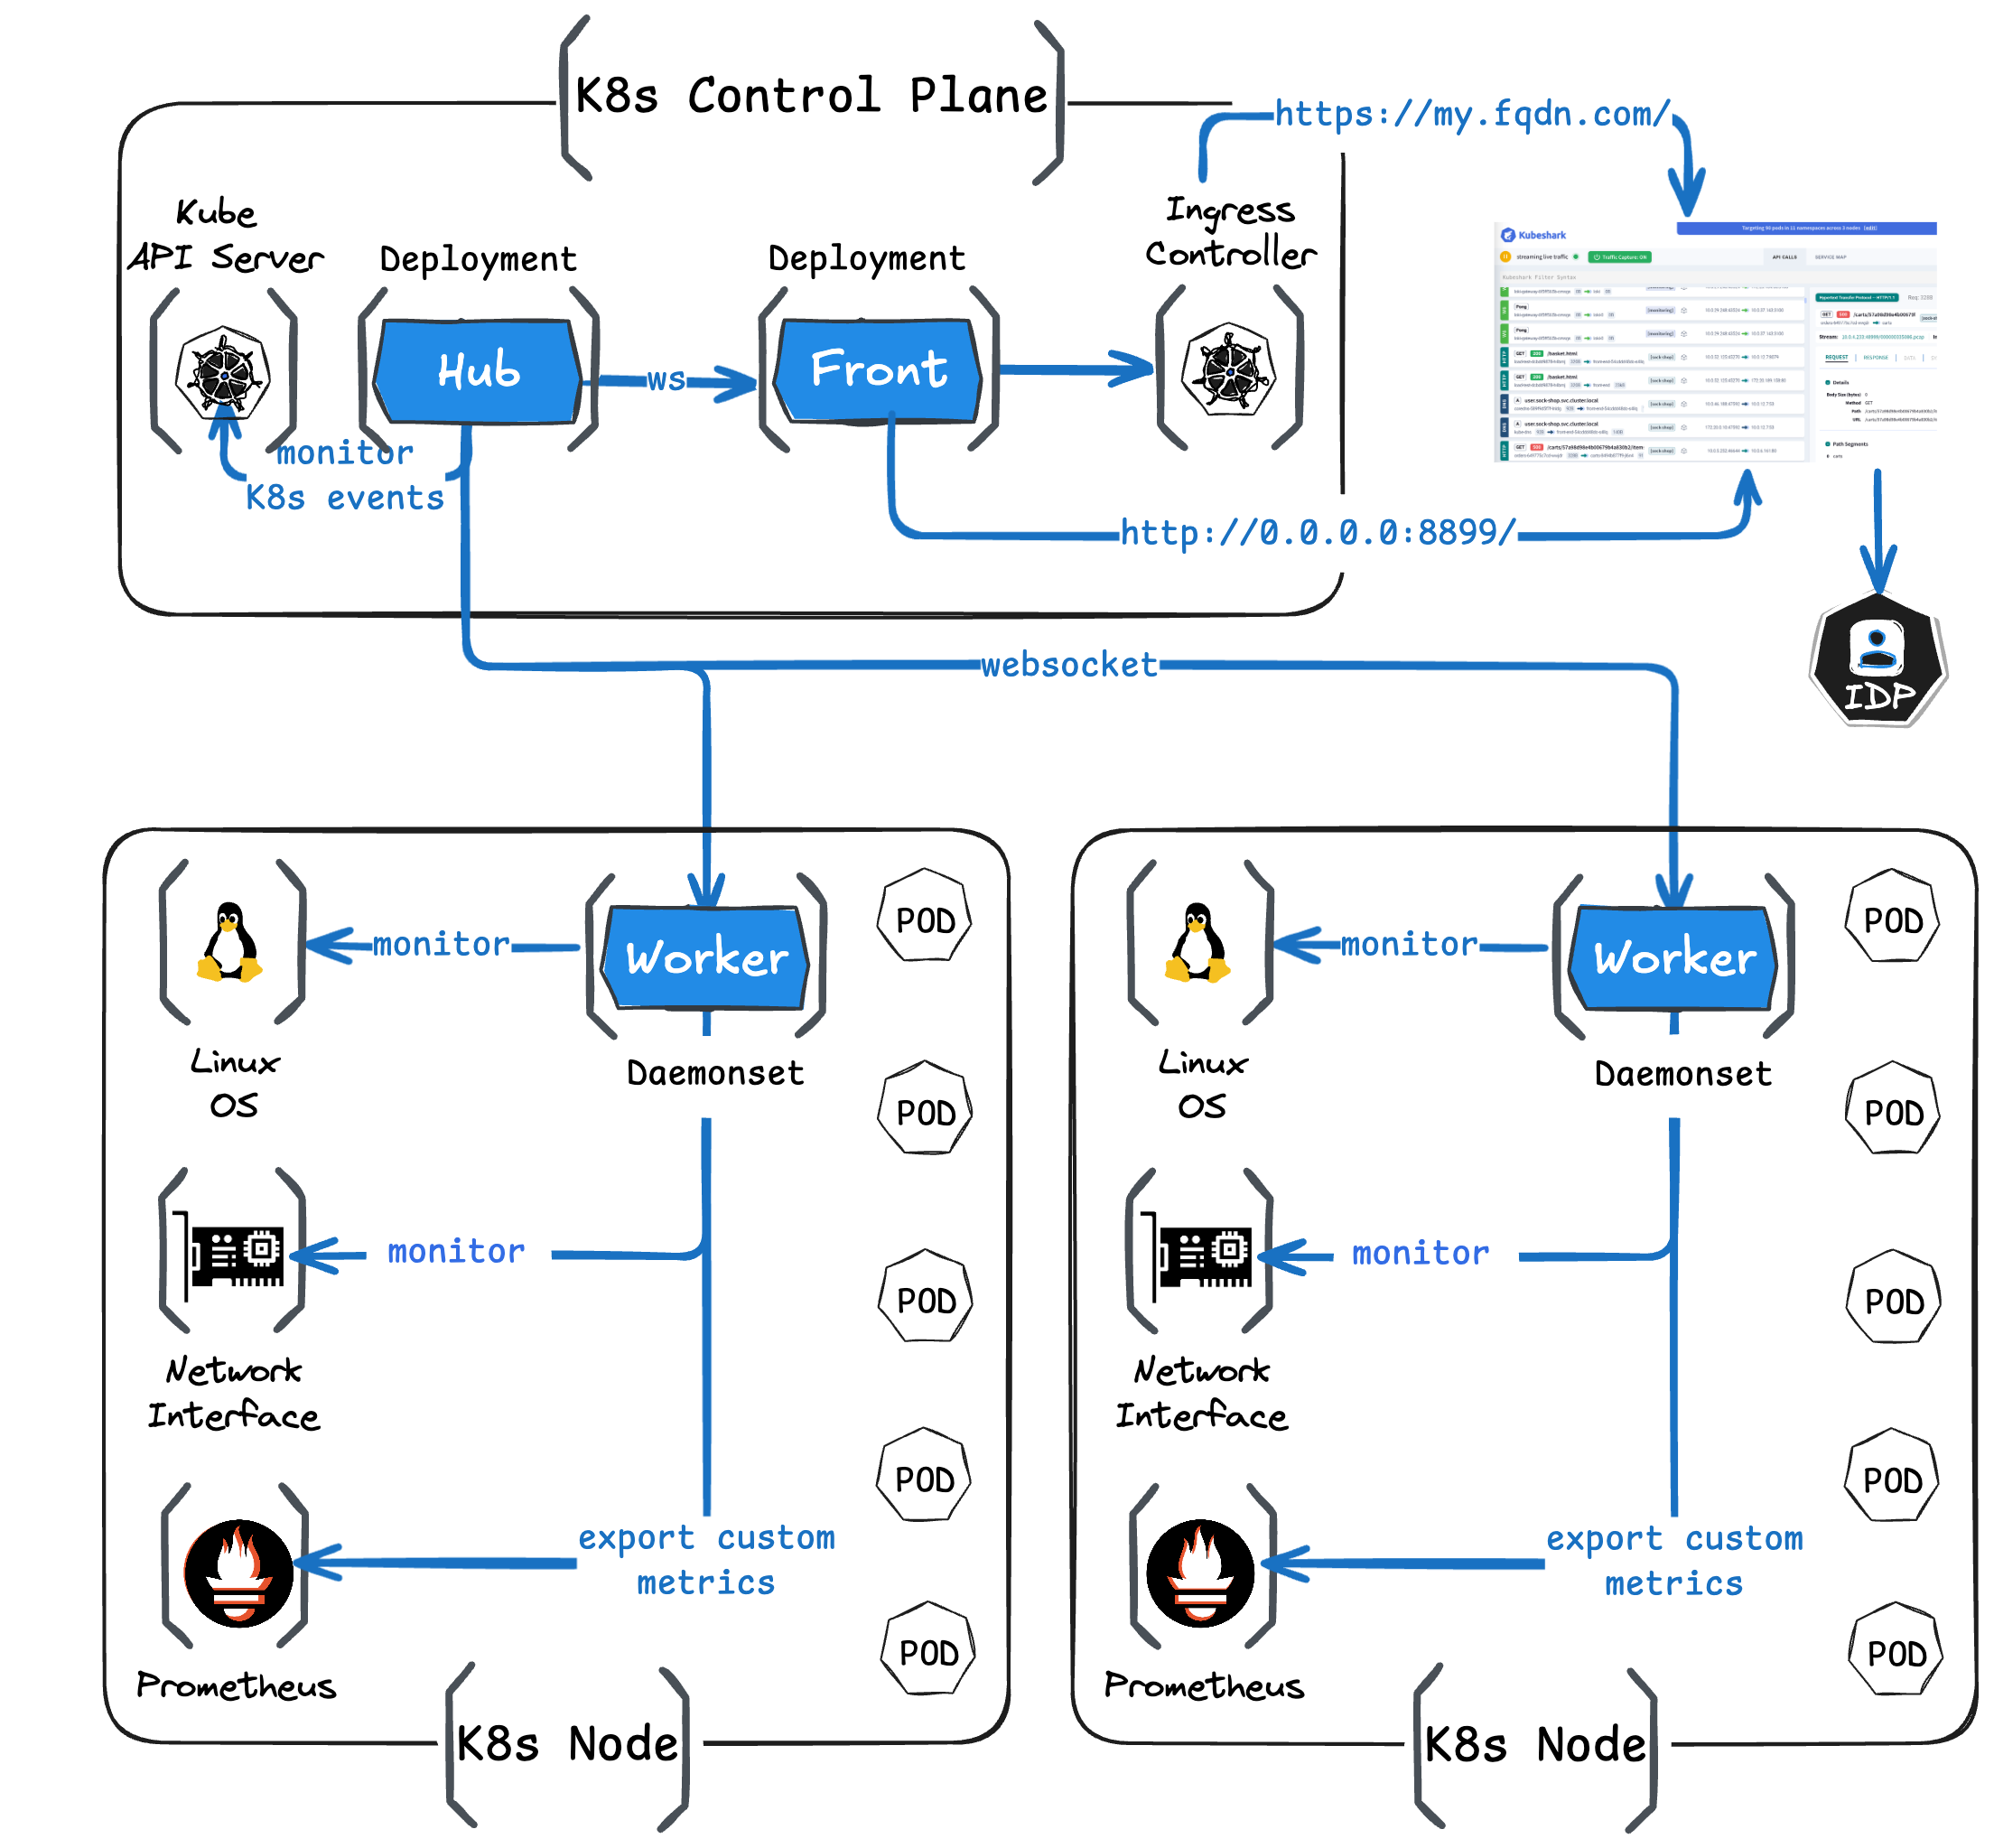
Kubeshark monitors and correlates events from the Kubernetes API server, the Linux operating system, and network interfaces to provide a comprehensive view of your cluster’s activity.
Kubeshark supports all Kubernetes distributions and versions, including datacenter and cloud environments. It does not require any prerequisites such as CNIs, service meshes, or code instrumentation. It functions without the need for a proxy or sidecar and does not necessitate any changes to the existing architecture.
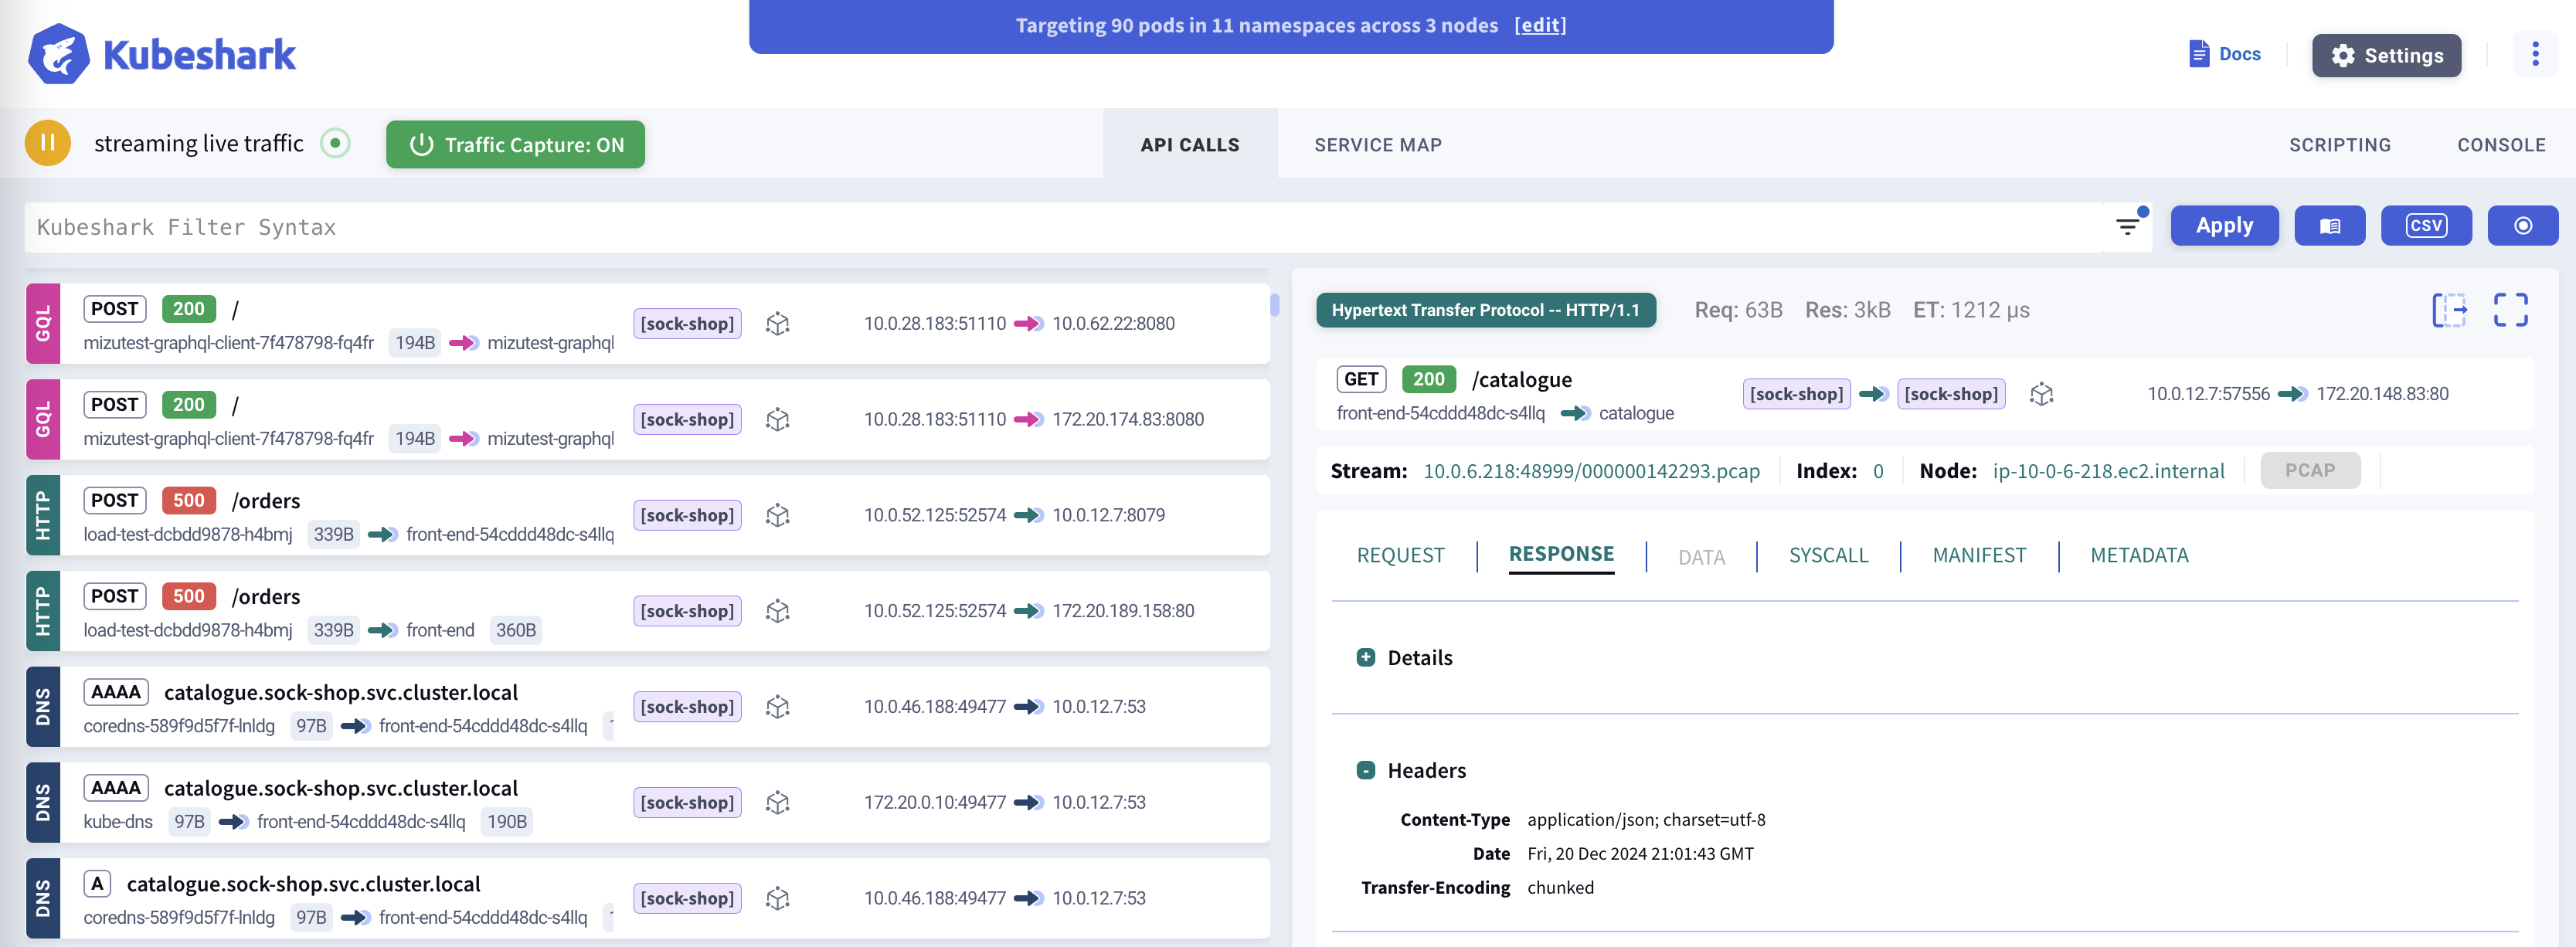
Dashboard
Kubeshark’s dashboard is a React application served via a port running on the front deployment. The front operates within the K8s control plane and communicates with the Hub via WebSocket, displaying captured traffic in real-time as a scrolling feed.
Once Kubeshark is deployed, access to the dashboard can be provided using one of the following methods:
port-forward: A Kubernetes functionality. The quickest method, yet the least recommended, as port-forward isn’t performant and can break quickly.kubeshark proxy: A CLI command that maintains akube-proxyor aport-forwardconnection, attempting to re-establish the connection when it breaks.- Ingress Controller: The most recommended method. Stable, performant, and secure.
Kubeshark further supports integration with corporate Identity Providers (IDPs) using SAML for authentication and authorization.
Checkout the live demo portal, running on EKS using Ingress over HTTPS connected to an IDP and many other features live.
Hub
The Hub is a K8s deployment that consolidates all Worker streams into a single stream and relays that consolidated stream to the Dashboard. It operates together with the Dashboard and only when there’s an active Dashboard connection.
The Hub monitors the K8s API server and helps correlate those events with the rest of the events monitored by Kubeshark (e.g., network and Linux OS events).
Worker
Workers perform the heavy lifting in Kubeshark. They operate continuously, independently from the Hub or the Dashboard. They capture traffic from the network interface and monitor the Linux operating system. Traffic processing includes:
- Capturing traffic from the network interface using either AF_PACKET or eBPF.
- Dissecting the raw traffic and reassembling the packets into protocol-level messages.
- Monitoring Linux OS events and correlating them with other events monitored by Kubeshark.
- Execute custom network processors that continuously process traffic and trigger actions.
Worker pods are deployed into the cluster at the node level as DaemonSets. Each DaemonSet includes two containers:
- Sniffer: A network packet sniffer.
- Tracer: An optional kernel tracer.
Workers also export custom metrics to Prometheus, which can be visualized in dashboards such as Grafana and Datadog.
Sniffer
The Sniffer is the primary container in the Worker pod, responsible for capturing packets using AF_PACKET (when eBPF isn’t enabled) and processing traffic up to fully reassembled messages.
Tracer
The Tracer is responsible for tracing kernel-space and user-space functions using eBPF (Extended Berkeley Packet Filter). eBPF is an in-kernel virtual machine running programs passed from user space, first introduced in Linux kernel version 4.4 and matured since then.
This functionality, performed by the Tracer container, includes:
- Capturing raw L4 traffic (a more robust alternative to using AF_PACKET).
- Capturing TLS traffic.
- Capturing syscalls.
Tracer deployment is optional and can be enabled or disabled using the tap.tls configuration value. When set to false, the Tracer won’t be deployed.
Data Retention
Workers process data primarily in-memory, with some data stored on the local Workers’ disk, which is ephemeral by default. Stored data is discarded after a pre-configured TTL (e.g., 10s, 5m). The entire Workers’ storage is purged when the Workers’ pods are evicted or uninstalled.
Read more about the TTL strategy here.
Unless explicitly triggered by the user (e.g., through scripting and integrations), no data leaves the premises.
CLI (kubeshark)
The CLI, a binary distribution of the Kubeshark client, is written in the Go language and typically named kubeshark. It is an optional component that offers a lightweight, on-demand option to use Kubeshark without leaving any permanent footprint.
Once downloaded, you can use the tap command to begin monitoring cluster-wide API traffic:
kubeshark tap                                       # tap all pods in all namespaces
kubeshark tap -n sock-shop "(catalo*|front-end*)"   # tap only pods that match the regex in a certain namespace