Actionable Network Observability
Gain deep visibility into every aspect of your Kubernetes (K8s) cluster.
Kubeshark empowers SREs, DevOps, and security teams with:
- Cluster-wide API traffic visibility
- Zero-touch, comprehensive distributed tracing
- Actionable network insights
Whether you’re responding to a production incident, troubleshooting anomalies, or preparing for future issues, Kubeshark makes the root cause instantly visible.
Think Wireshark—reimagined for Kubernetes, deployed everywhere, continuously capturing and analyzing traffic in real time.
Cluster-wide Visibility
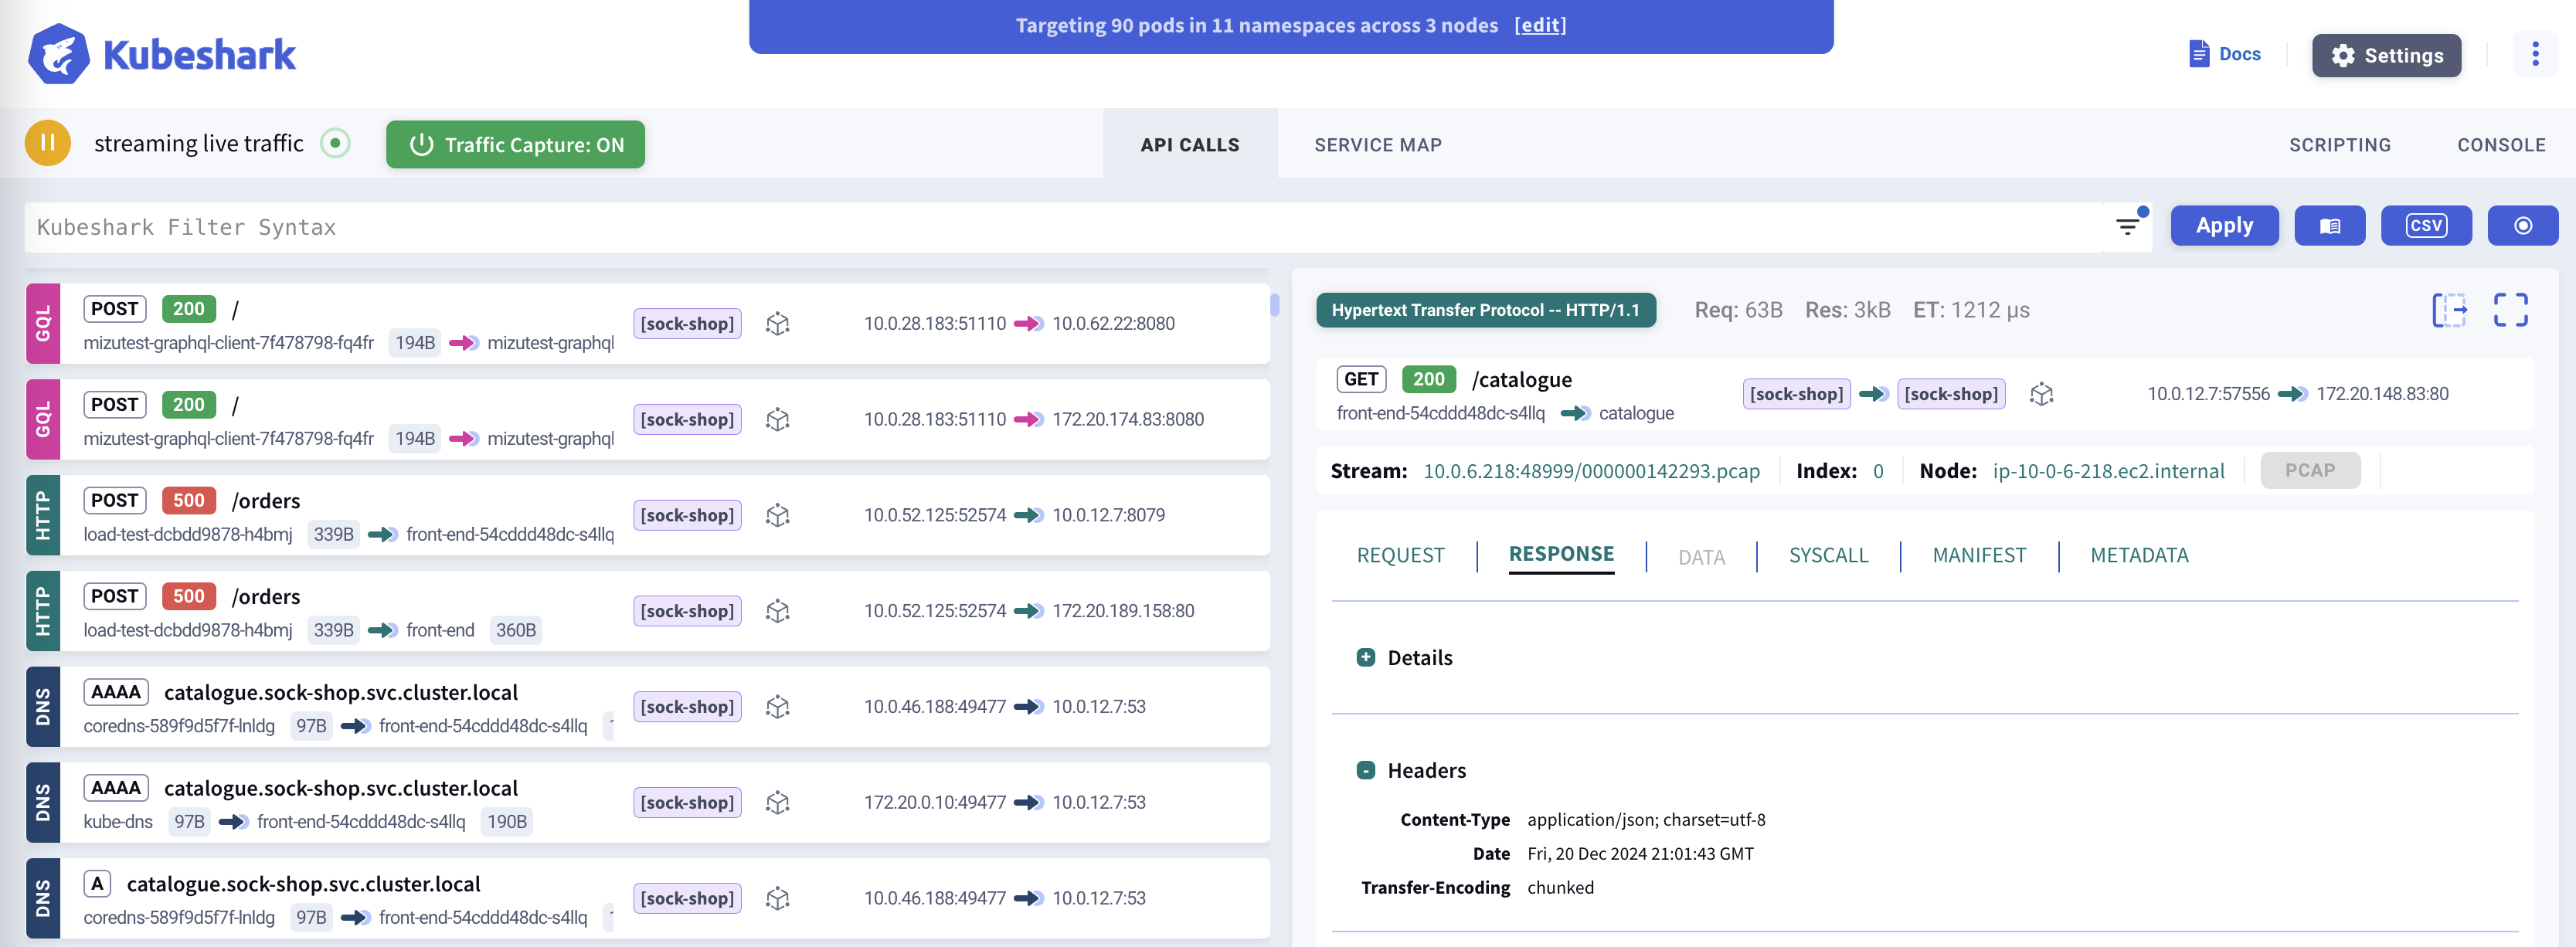
Kubeshark delivers real-time, identity-aware, protocol-level visibility into API traffic, enabling users to observe activity within every segment of their K8s clusters—even hidden ones.
Monitor all traffic, including encrypted (TLS) payloads, as it enters, exits, and flows through containers, pods, namespaces, nodes, and clusters.
Protocol Support
Kubeshark leverages advanced packet capture technologies such as eBPF and AF_PACKET to capture Layer 4 traffic (TCP, UDP, SCTP) across the cluster, reconstructing it into application-layer protocols. Supported protocols include:
- HTTP/1.0
- HTTP/1.1
- HTTP/2
- WebSocket
- AMQP
- Apache Kafka
- Redis
- gRPC over HTTP/2
- GraphQL over HTTP/1.1
- GraphQL over HTTP/2
- LDAP
- RADIUS
- DIAMETER
- ICMP
- DNS
- UDP
- SCTP
- TLS
- TCP
Kubeshark can intercept TLS traffic inside the cluster without decryption by hooking into runtime libraries such as OpenSSL, Go’s crypto/tls, and BoringSSL.
It also integrates seamlessly with service mesh solutions like Istio, Linkerd, and others, displaying mTLS traffic in clear text.
Traffic Recording & Offline Analysis
When issues aren’t immediately detectable during live observation, you can schedule or trigger traffic recording based on specific events. Recorded traffic can be analyzed offline and uploaded to immutable storage systems (e.g., AWS S3, GCS) for long-term retention.
Automatic Distributed Tracing
Kubeshark provides full visibility into every API call—latency, throughput, bandwidth, and payload included. You can view complete traces and define custom spans using a powerful query language. Every trace is enriched with:
- Network context – Access full payloads, including encrypted ones—not just headers.
- Kubernetes context – Understand each span’s placement within namespaces, pods, and identity metadata.
- Linux OS context – Inspect process IDs, paths, socket info, and more.
Kubeshark requires no code instrumentation, CNI changes, sidecars, service meshes, or architectural adjustments.
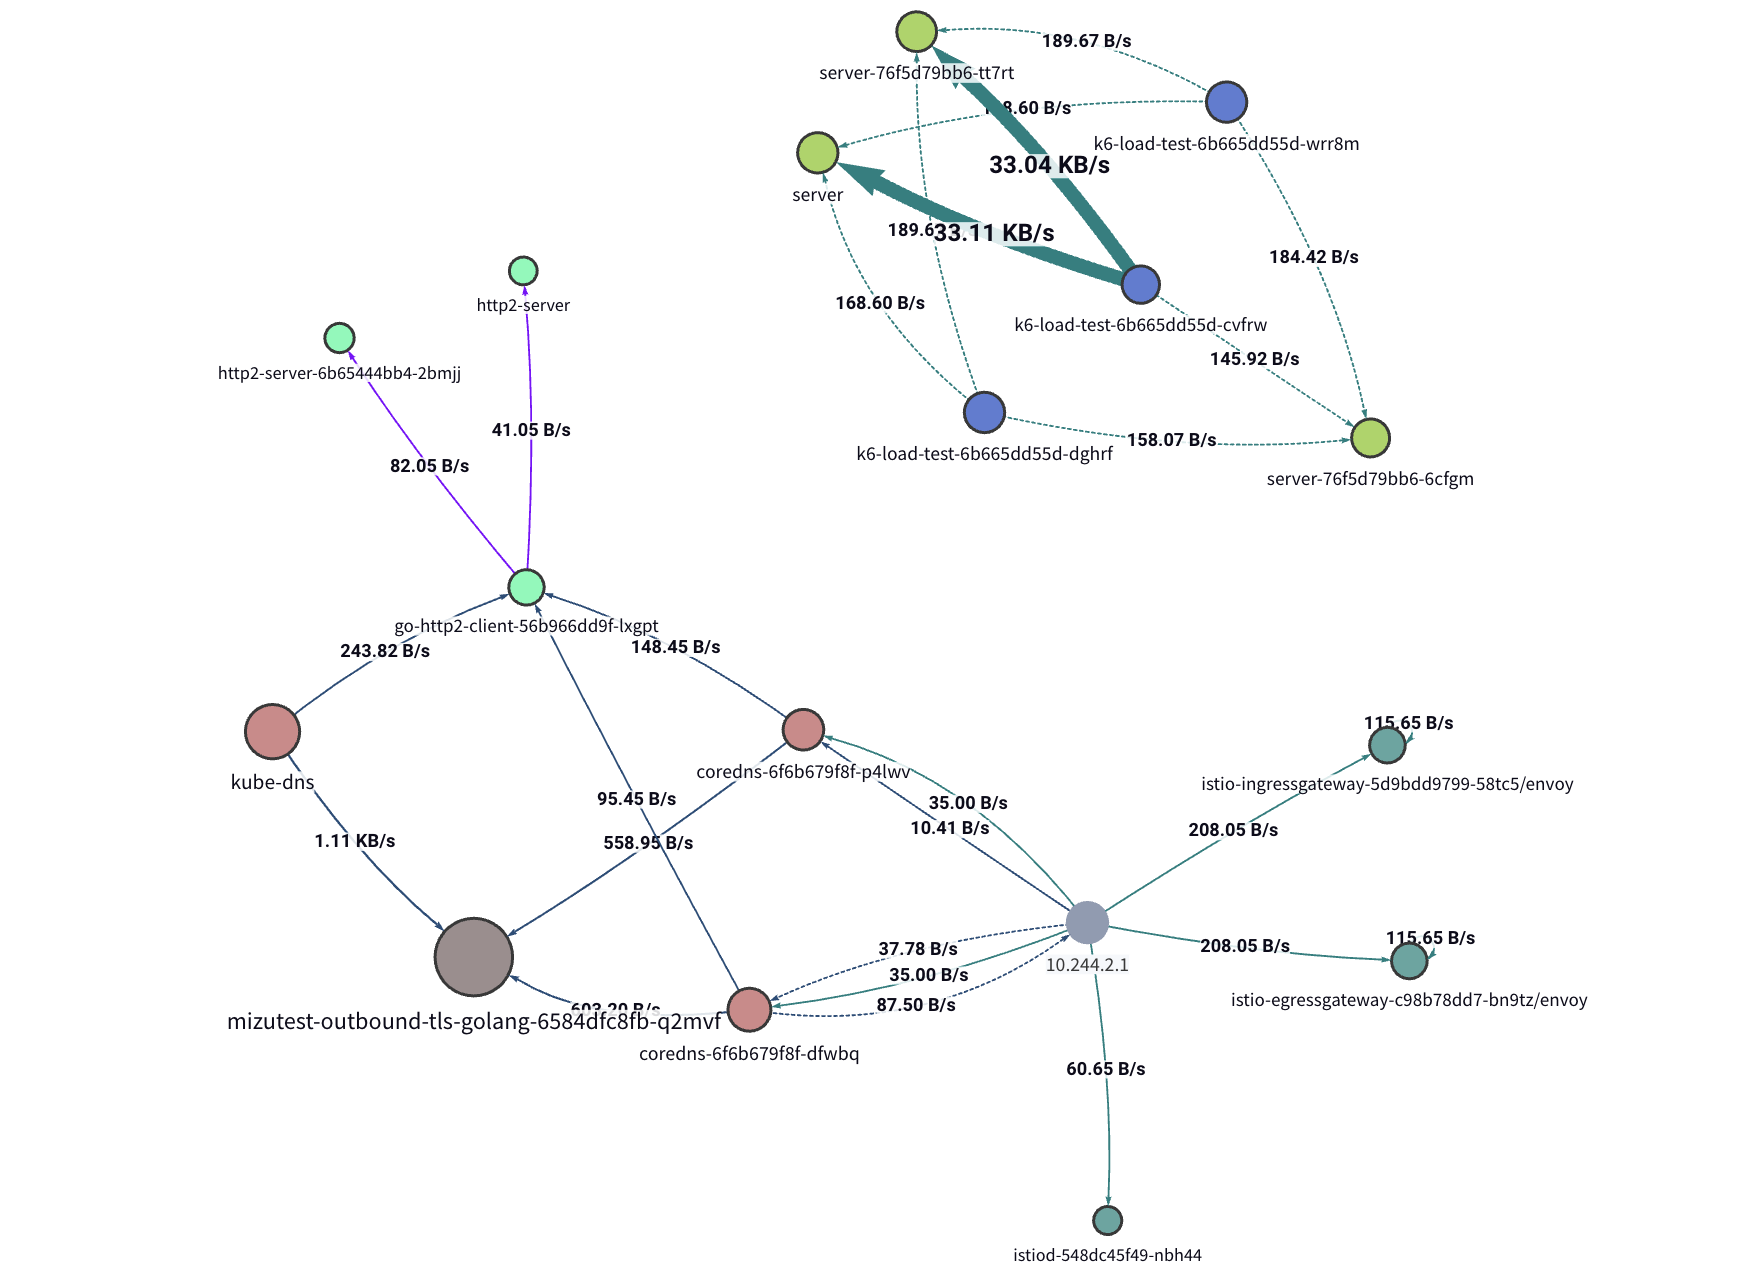
Actionable Network Insights with Network Agents
Users can create and run unlimited Network Agents, each handling a specific network automation task.
Agents can detect anomalies, enforce policies, export metrics and logs, generate reports, or record traffic on demand.
Creating an Agent
Start with a template or build from scratch using our GenAI assistant.
Each agent is powered by a customizable JavaScript script.
Agents observe traffic via hooks and trigger actions using helpers.
Optional LLM Connection
Connecting to an external LLM is optional and can be fully disabled for air-gapped environments.
If enabled, each Network Agent maintains a persistent LLM connection to:
- Send JSON data over time and receive actionable insights (e.g., anomaly detection).
- Continuously refine and improve the agent’s logic.