The Dashboard
Dashboard Overview
The primary purpose of the dashboard is to display real-time traffic streams using backend and display filters.
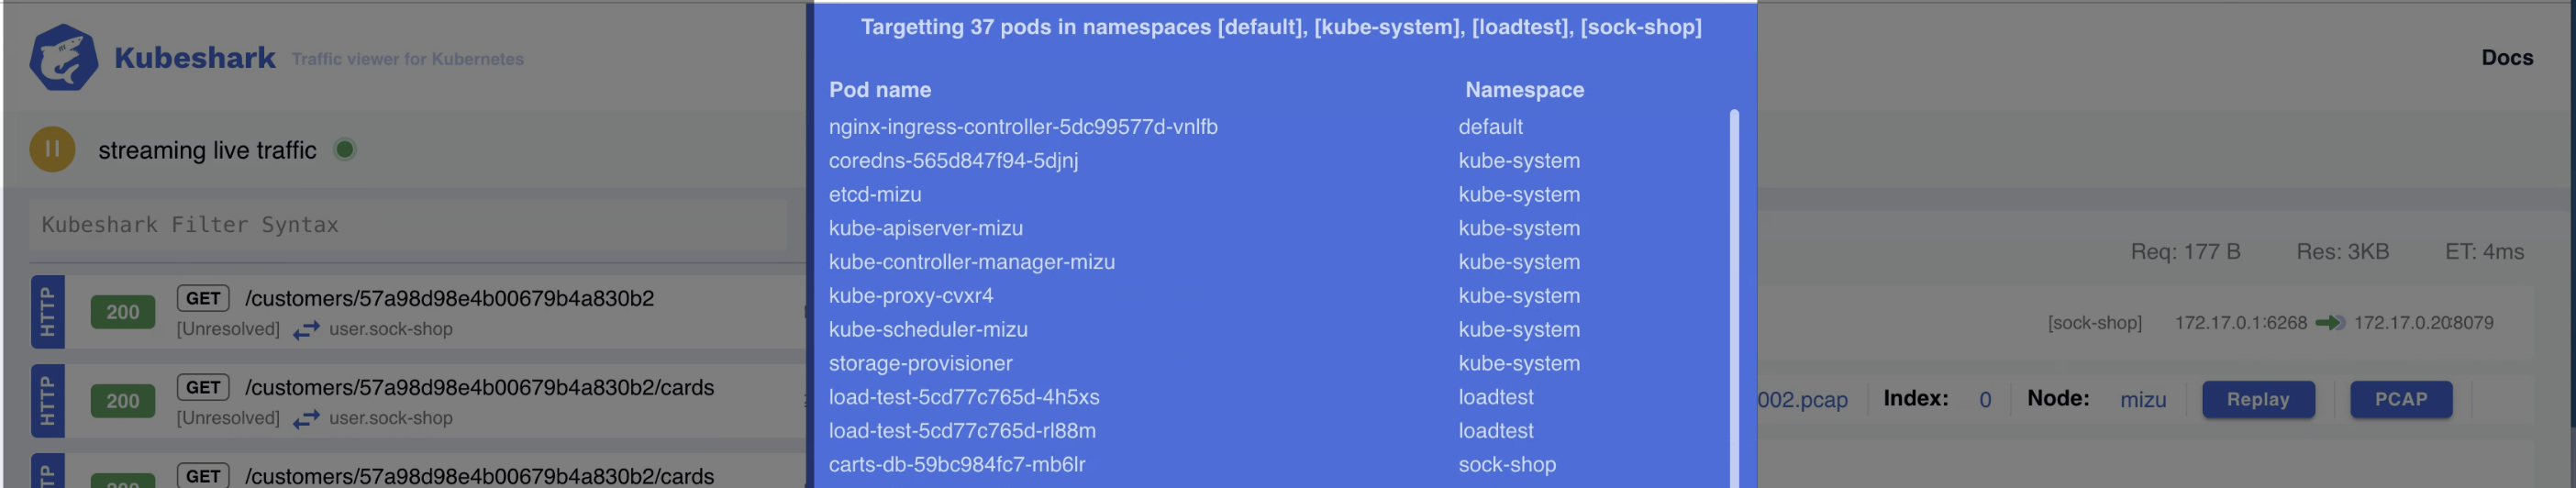
Backend Filters & Targeted Pods
Kubeshark targets specific pods based on their attributes. Backend filters define the criteria used to generate the list of targeted pods. This list can include future pods (e.g., pods that haven’t started yet but match the filter criteria). Since Kubeshark dynamically tracks pod lifecycle events, the targeted pod list updates in real time.
Traffic from non-targeted pods is discarded.
The active list of targeted pods appears in the blue dialog window at the top of the dashboard.
Display Filters & KFL
Display filters differ significantly from backend filters. While backend filters affect all of Kubeshark, display filters only impact a specific dashboard tab.
Display filters use the Kubeshark Filter Language (KFL) to control what traffic is shown in the UI. Each query is local to the browser tab where it’s applied, allowing multiple tabs (or even browser windows) to show different filtered views of the same cluster.
Note: Backend filters apply globally across all users, dashboards, and browser sessions.
KFL queries help narrow the traffic scope or focus on specific elements. For example, to display only HTTP responses with status codes starting with 4, use:
http and response.status == r"4.*"Click Apply, and the filtered traffic stream will appear as shown:
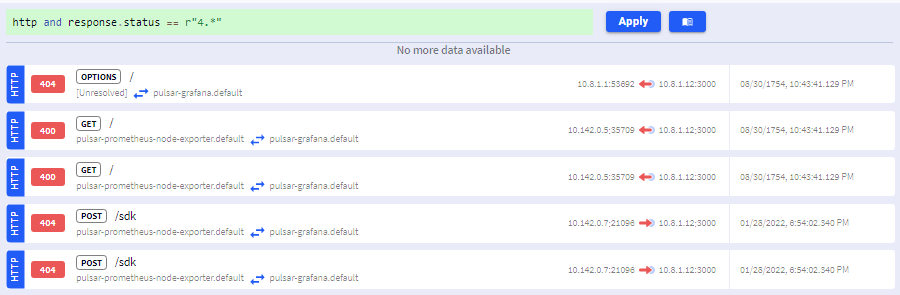
You can also filter by timestamp, numeric values, and UI-based query elements. A syntax cheatsheet is available next to the query input box.
Learn more in the filtering section.
Queryable UI Elements
Hovering over UI elements with a green plus sign indicates that they are queryable. Clicking them appends a corresponding filter to the KFL statement.
For example:
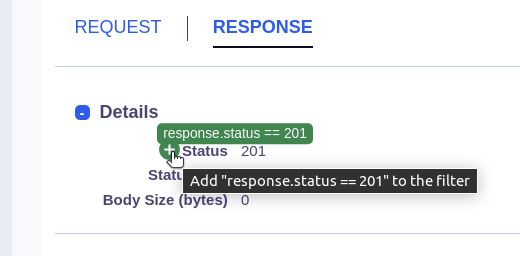
…adds response.status == 201 to your current query, filtering the stream to only include HTTP 201 responses.
Dashboard URL
When a query is run, it is automatically embedded into the browser’s URL. This enables bookmarking or sharing the exact filtered view.
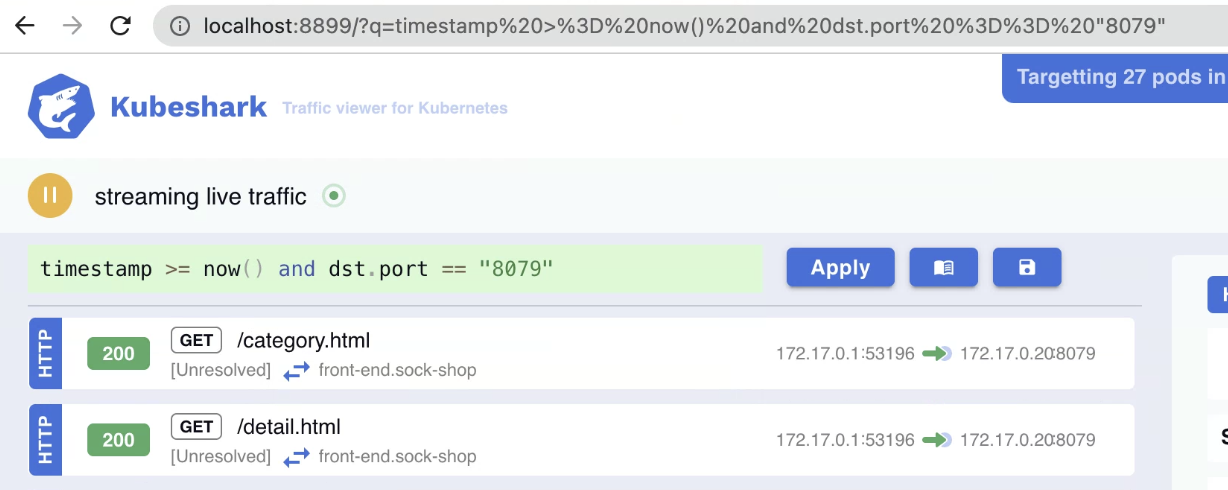
You can copy and share the URL with colleagues to give them the same real-time filtered view of the traffic.
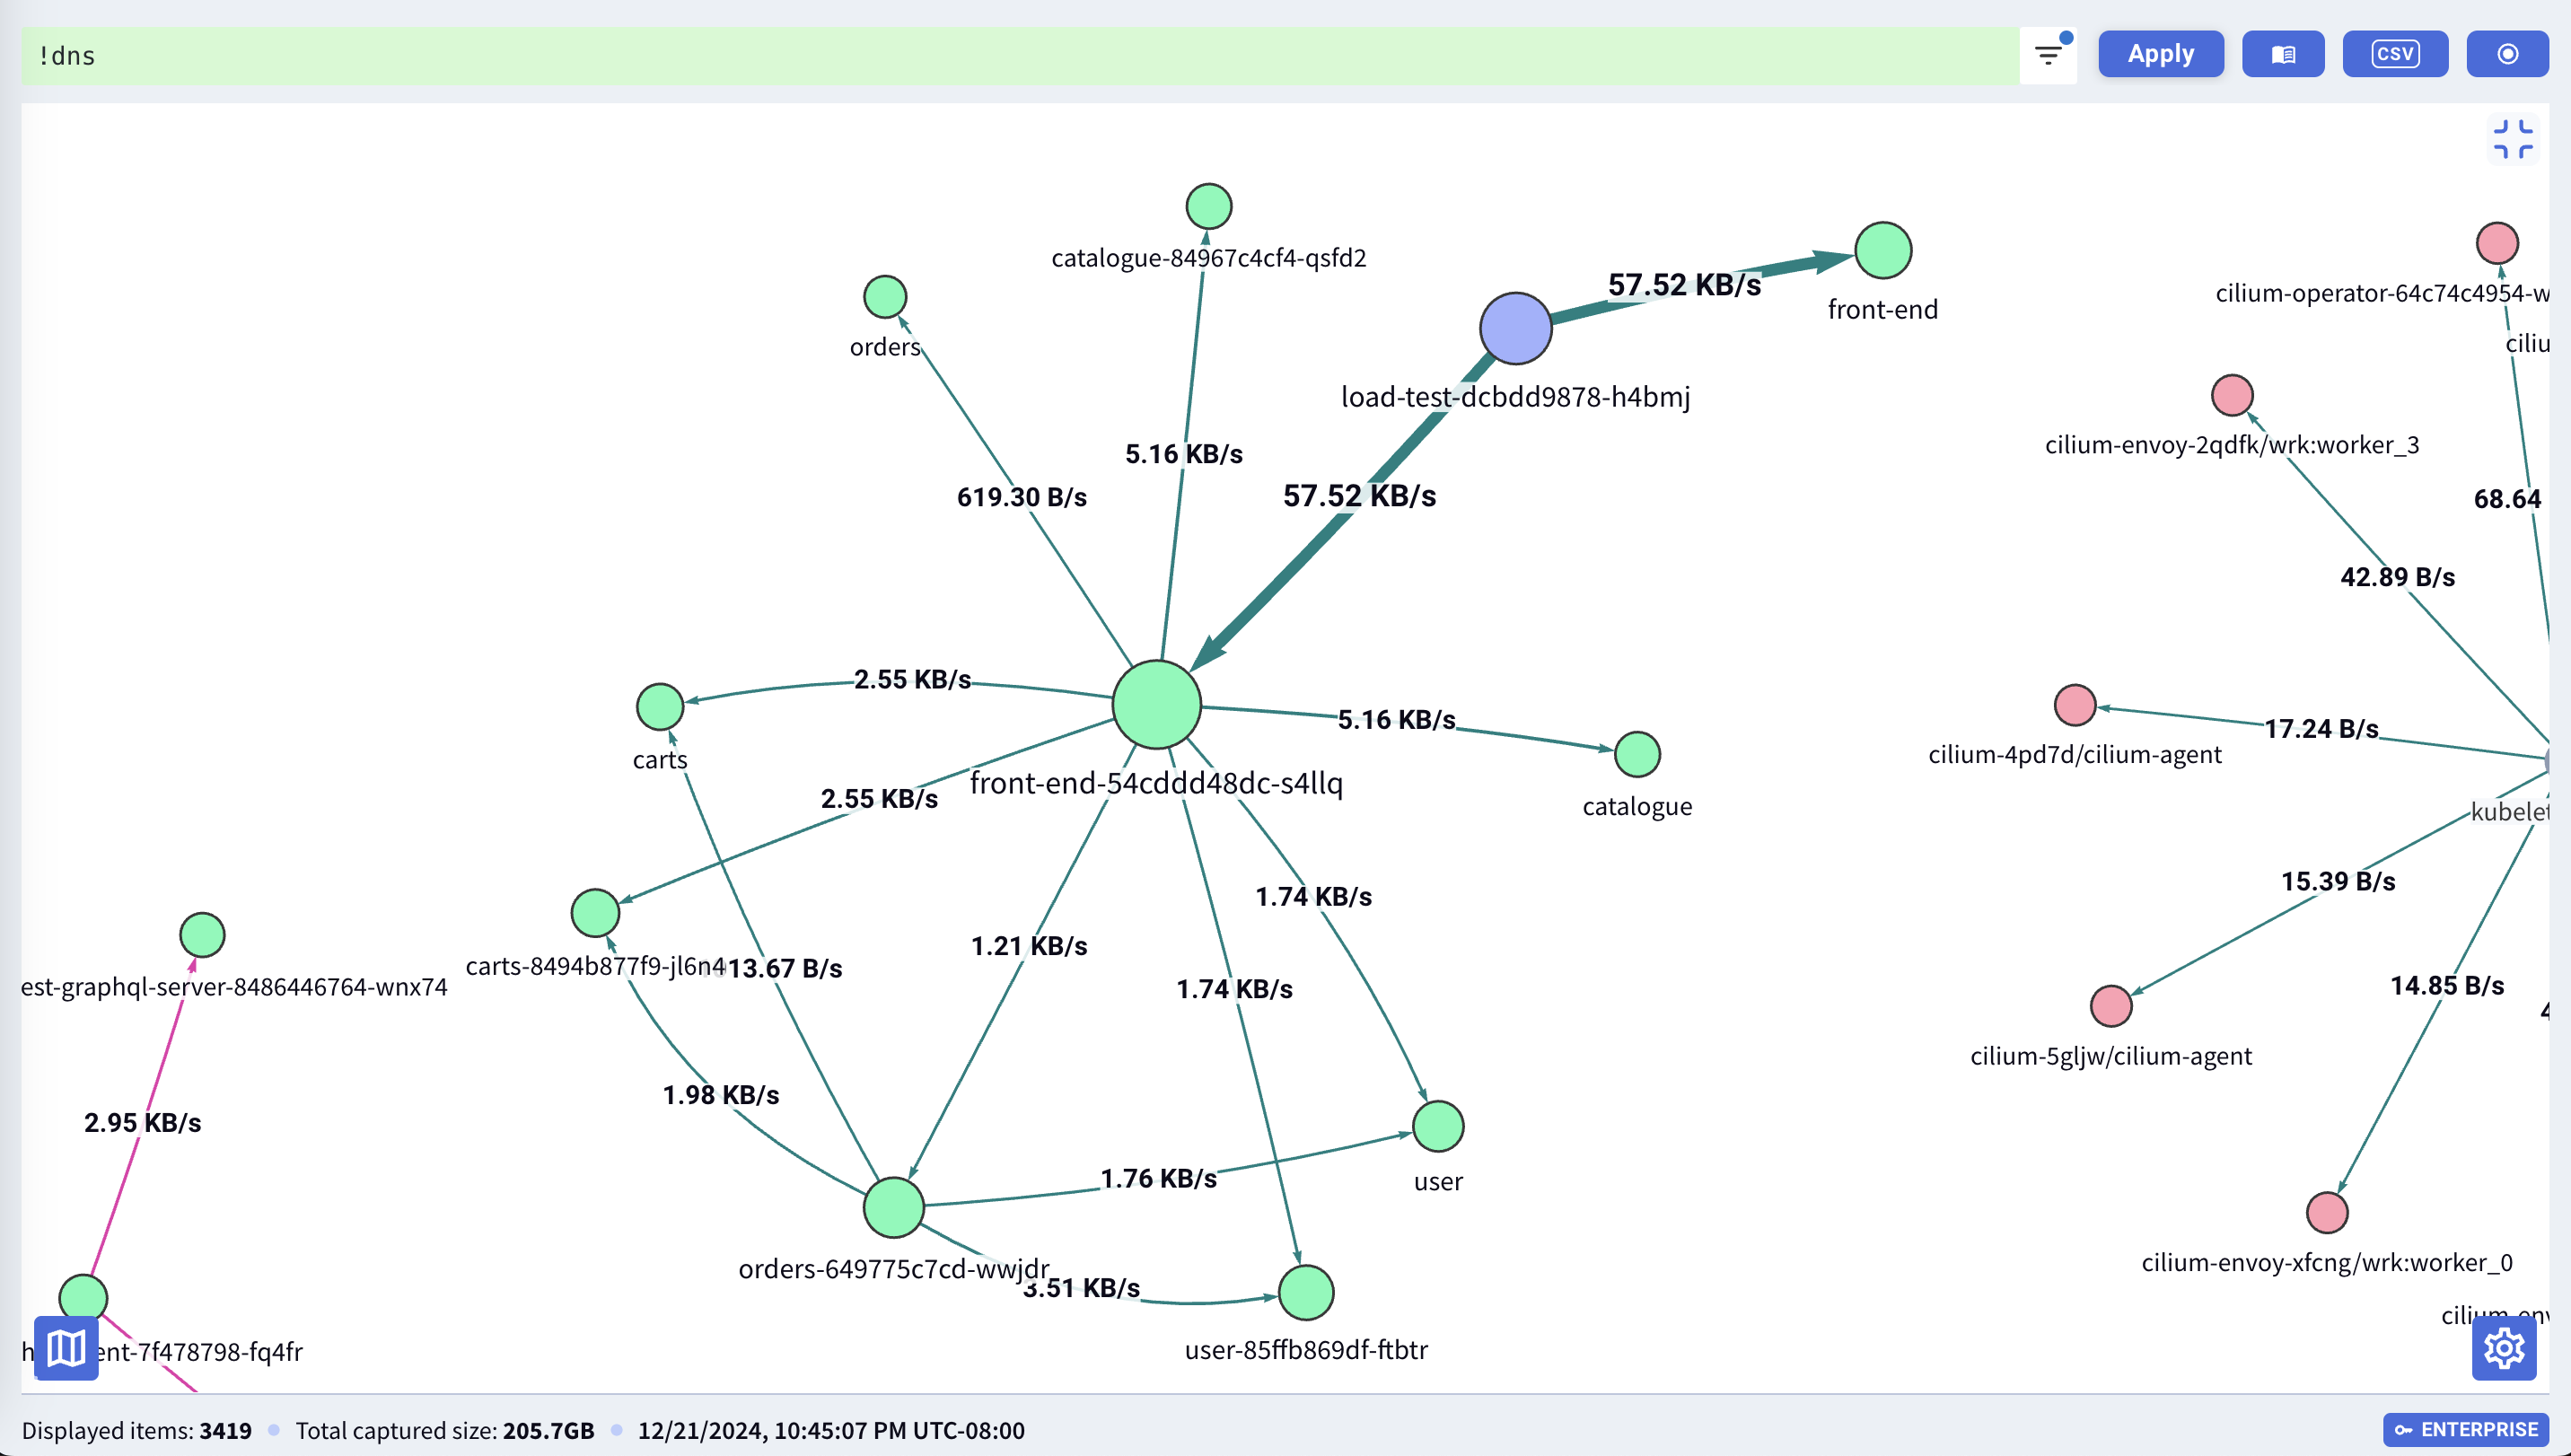
Service Map in Kubernetes Context
The Service Map updates live and provides a real-time visual of traffic dependencies within the cluster or a filtered subset.
Streaming Traffic
The left pane shows real-time traffic entries captured by Workers and streamed through the Hub to the dashboard. Each entry includes metadata such as protocol, status code, HTTP method, source/destination IPs, and pod information.

Streaming continues until:
- You manually stop it.
- Kubeshark automatically switches to showing historical traffic.
Example to view only live traffic:
timestamp >= now()This is the default query when opening the dashboard.
Example to show HTTP traffic with status code 500:
http and response.status == 500Stop Streaming
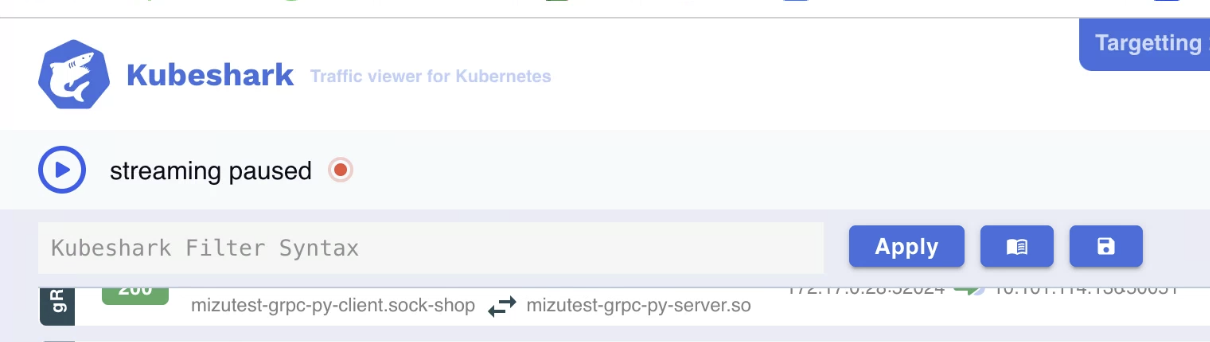
Scrolling up within the traffic pane signals that you’re reviewing historical data, which automatically pauses streaming. Alternatively, click the pause button at the top of the left pane.
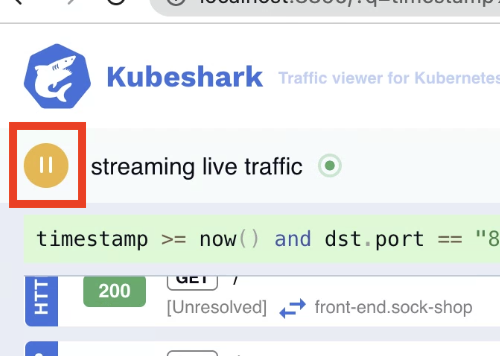
Stopping the stream in the dashboard does not stop traffic capture. Traffic continues to be recorded until Kubeshark is shut down.
Resume Streaming
To resume live streaming, click the play button at the top of the left pane.
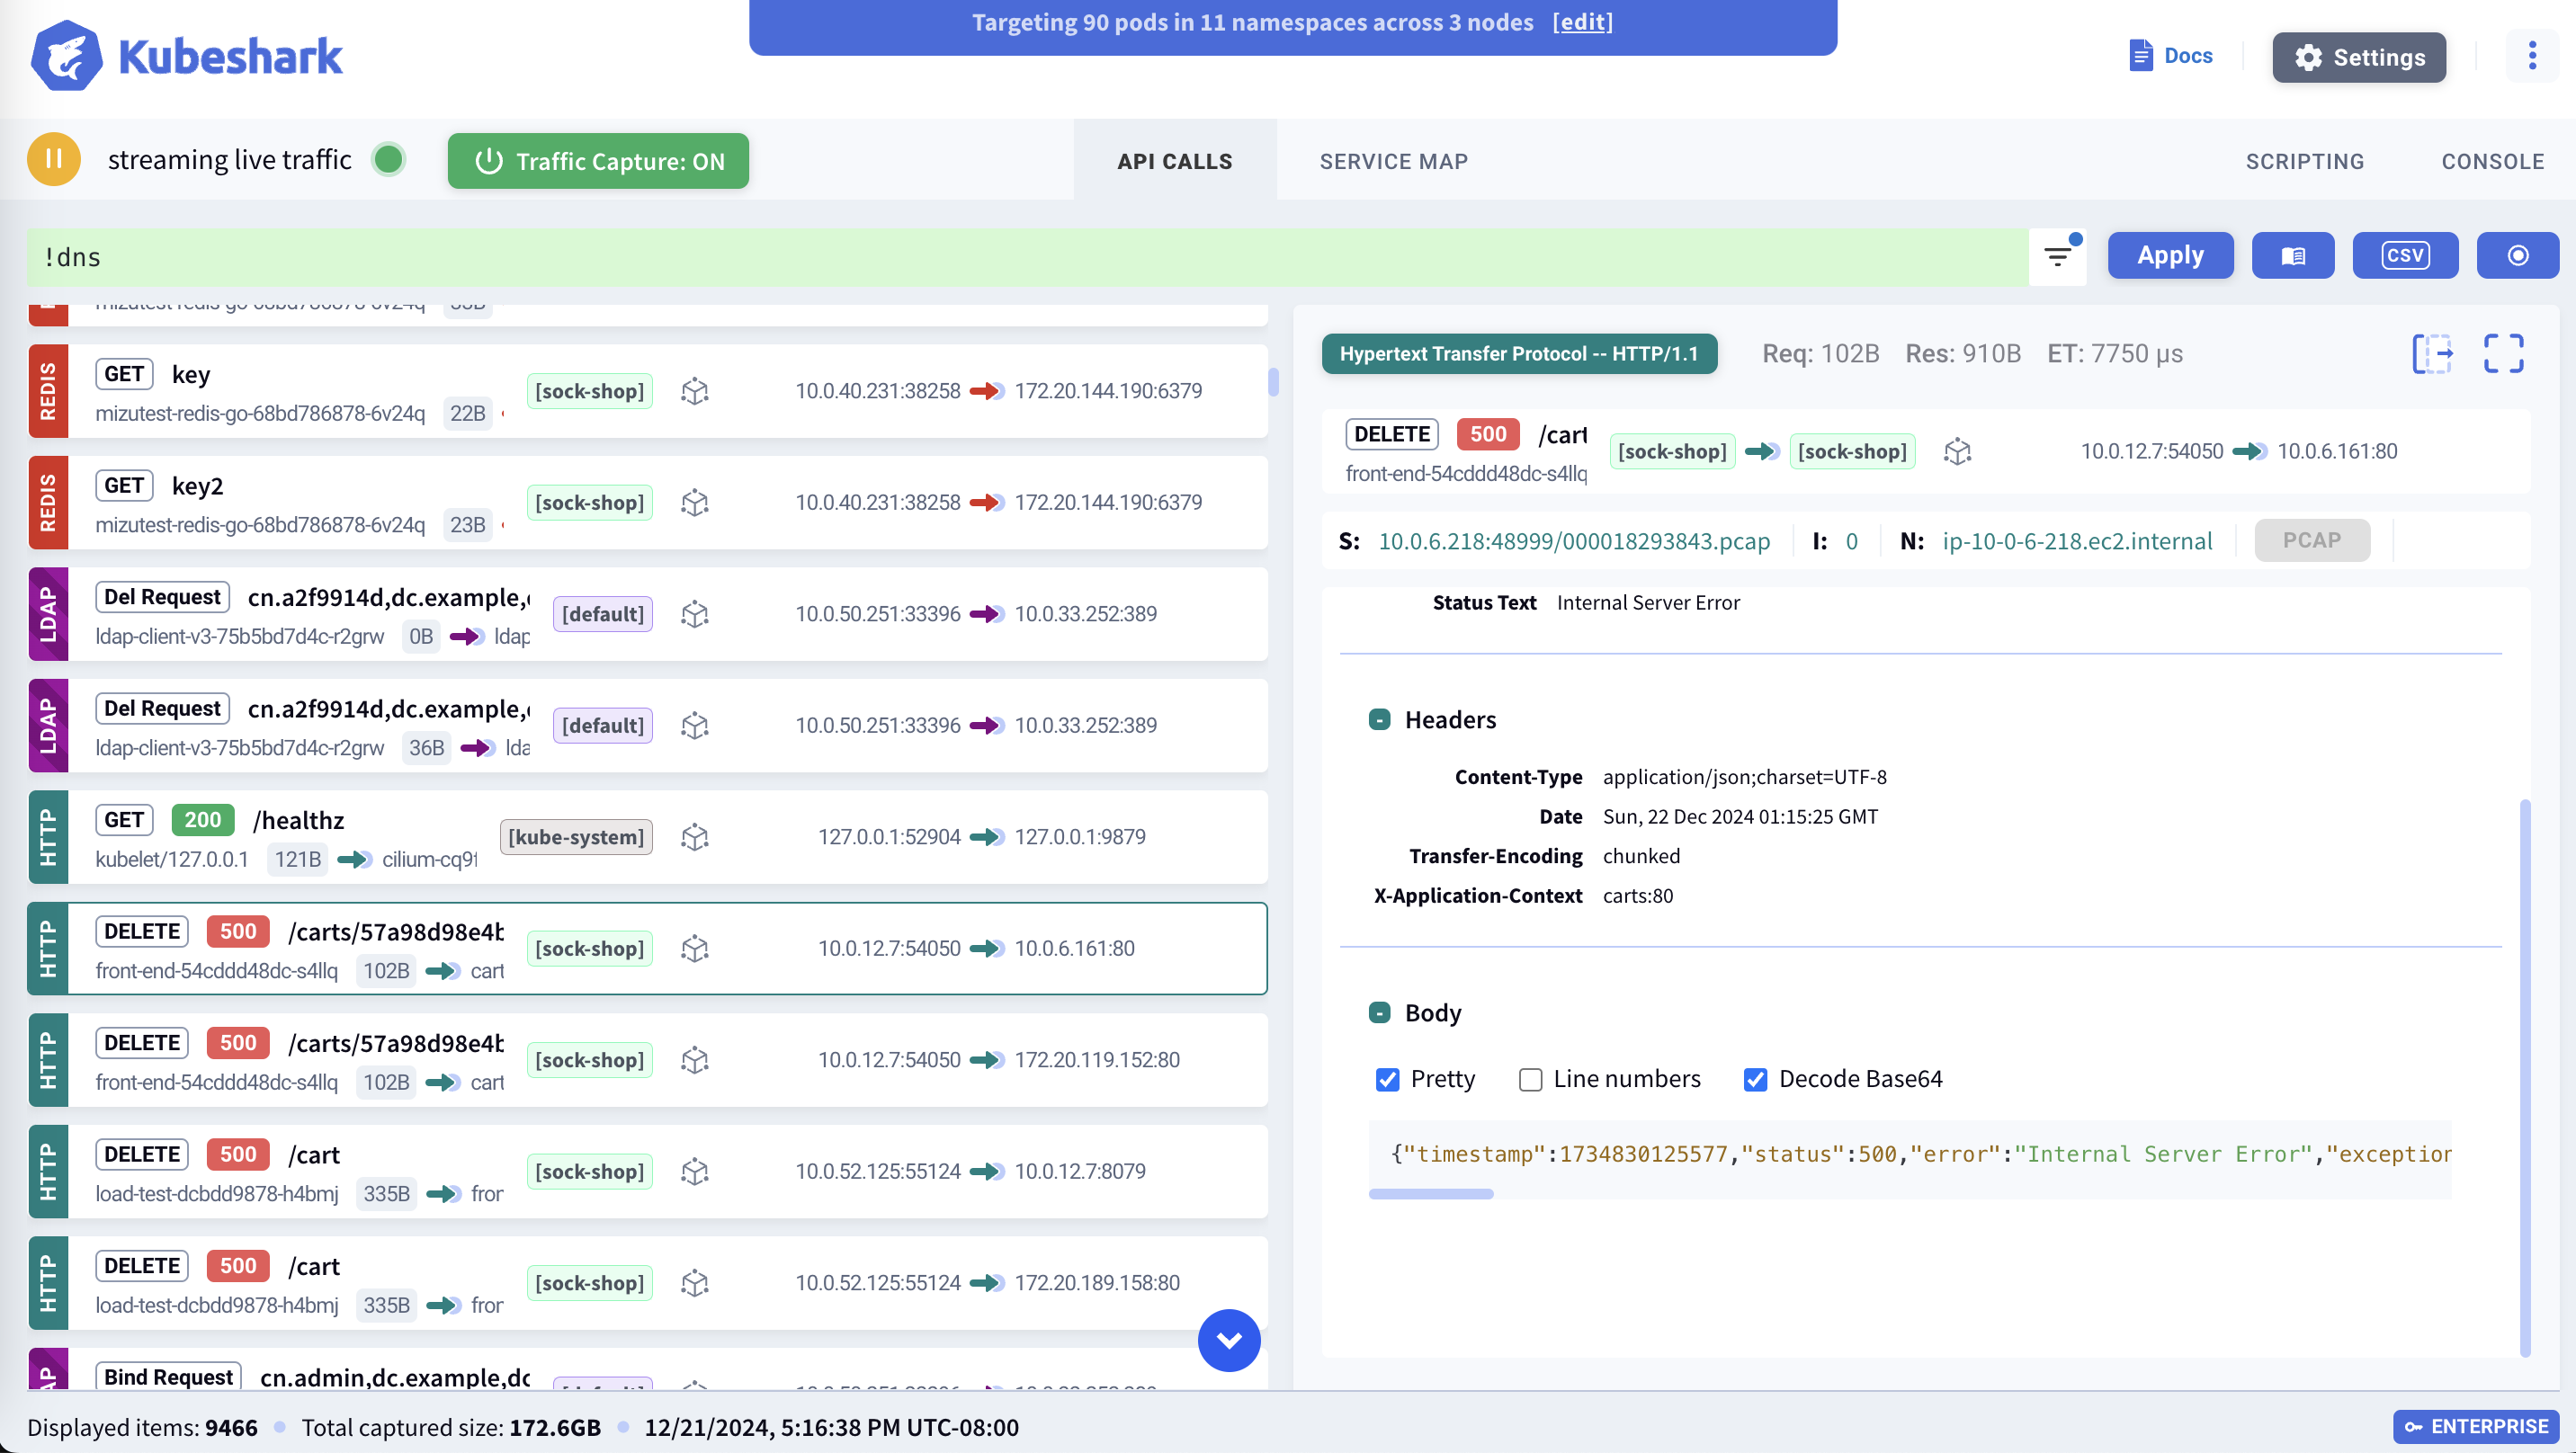
Traffic Entry Panel
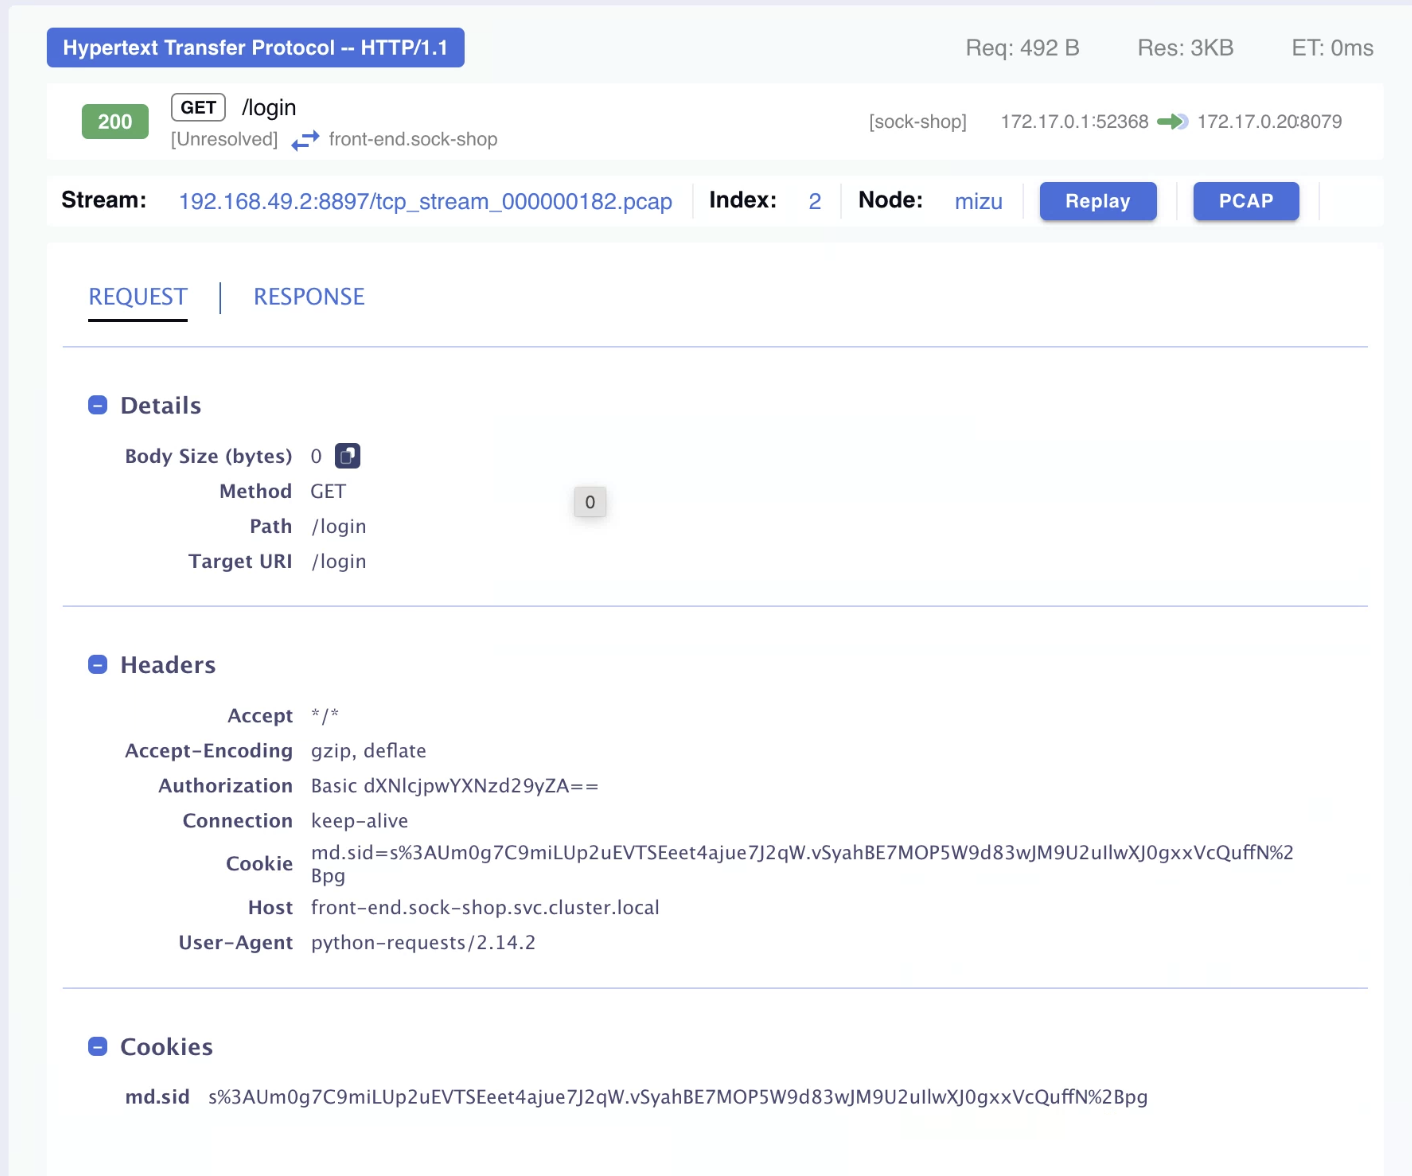
The right pane displays full details for a selected traffic entry, including metadata such as protocol, source/destination, method, pod names, and performance KPIs like latency and request/response size.
TCP Stream Information
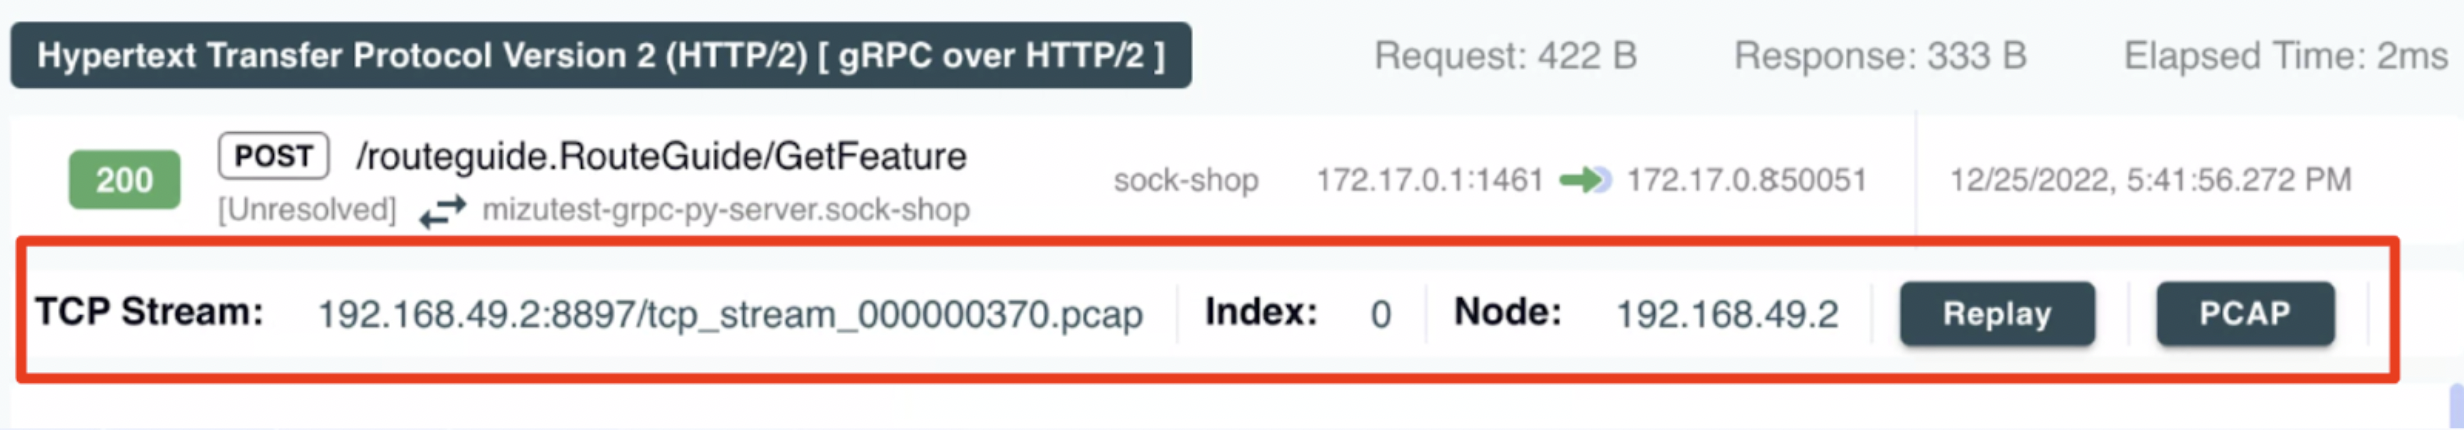
Each traffic entry is part of a TCP stream, which may contain multiple request-response pairs. The TCP stream panel provides contextual information such as:
- Request-response pair index
- Node and worker handling the stream
- TCP stream identifier
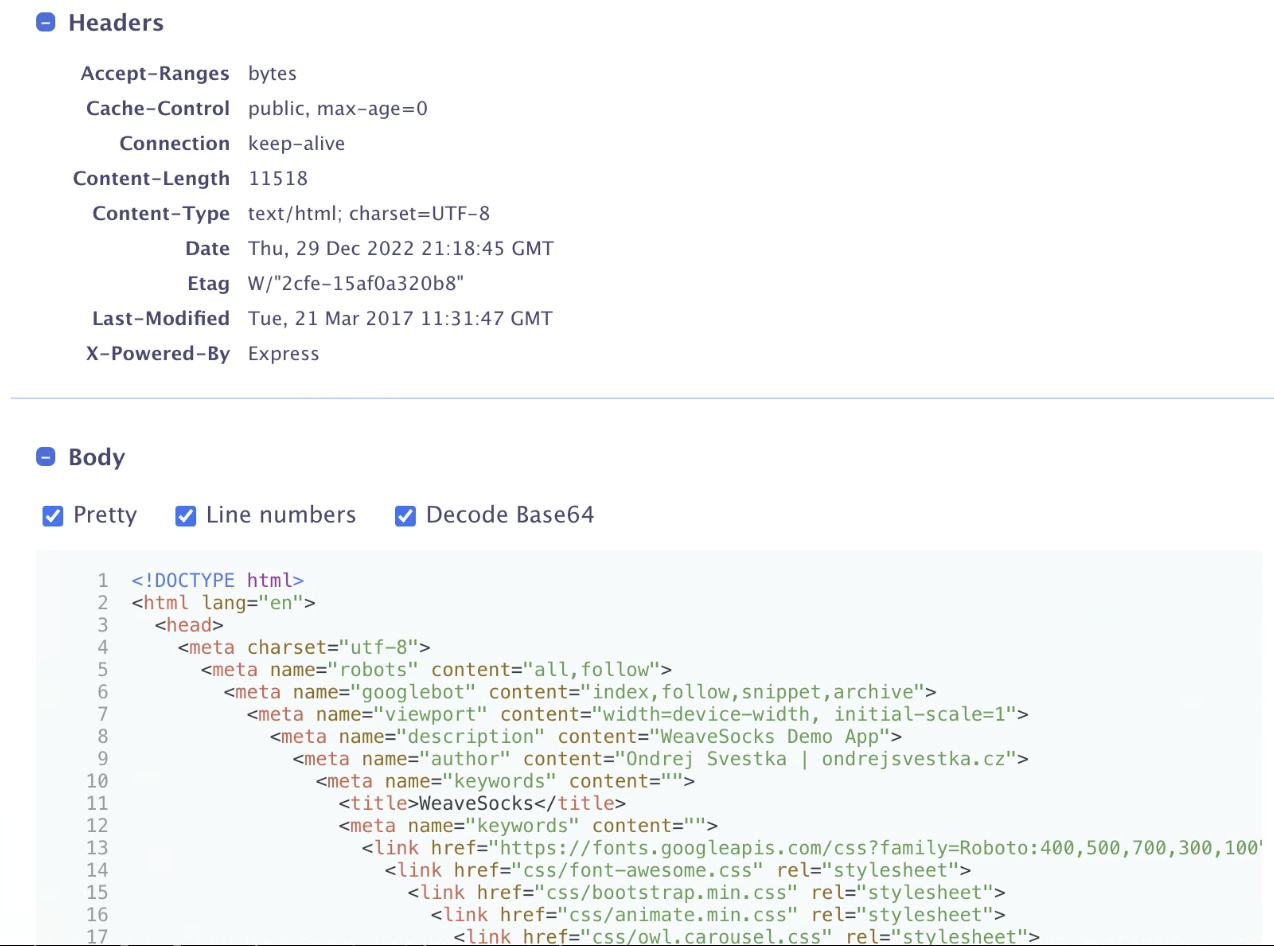
Request/Response Metadata & Payload
The right pane also displays the full headers and payload of each request and response in a human-readable format.