Prometheus Metrics & Grafana Dashboard
Custom Metrics from Network Information
You can create custom metrics using information gathered from network traffic and export them to Prometheus. Hooks are used to monitor the traffic and can be utilized to create custom metrics. A helper is available to export metrics to Prometheus, typically as part of a scheduled job, ensuring minimal impact on CPU and memory consumption.
Examples of custom metrics:
- Count DNS requests per pod.
- Count status codes per API call.
- Count occurrences of a specific pattern (e.g., when a response field is empty).
Creating a Custom Metric (Best Practice)
It is recommended to create custom metrics using one of the available hooks.
Example:
var dnsCounts = {};

function onItemCaptured(data) {
  if (data.protocol && data.protocol.name === "dns" && data.src && data.src.name) {
    var podName = data.src.name;
    if (!dnsCounts[podName]) {
      dnsCounts[podName] = 0;
    }
    dnsCounts[podName]++;
  }
}
Prometheus Metrics Helper
Kubeshark can export both pre-existing and custom Prometheus metrics. Almost any network-based event can be turned into a custom metric. See below for a list of built-in metrics. A script can also be used to calculate and export custom metrics using the prometheus.metric helper.
Example:
prometheus.metric(
  _metric_name_,          // Metric name
  "Metric description",   // Metric description
  1,                      // Metric type: 1 - Counter, 2 - Gauge, 3 - Untyped (float)
  64,                     // Value
  {                       // Labels
    s_metric: "dnscounts",
    s_pod: podName
  }
);
Exporting Custom Metrics
It is recommended to export custom metrics as part of a scheduled job to ensure efficient resource utilization.
Example:
jobs.schedule("export-metrics", "*/10 * * * * *", function () {
  for (var podName in dnsCounts) {
    prometheus.metric(
      "dnscounts_" + podName,
      "DNS request count per pod",
      1,
      dnsCounts[podName],
      { s_metric: "dnscounts", s_pod: podName }
    );
  }
});
Visualizing in Grafana
Once the script is executed, you can use the following PromQL query to display the custom metric on the Grafana dashboard:
rate({s_metric="dnscounts"}[$__rate_interval])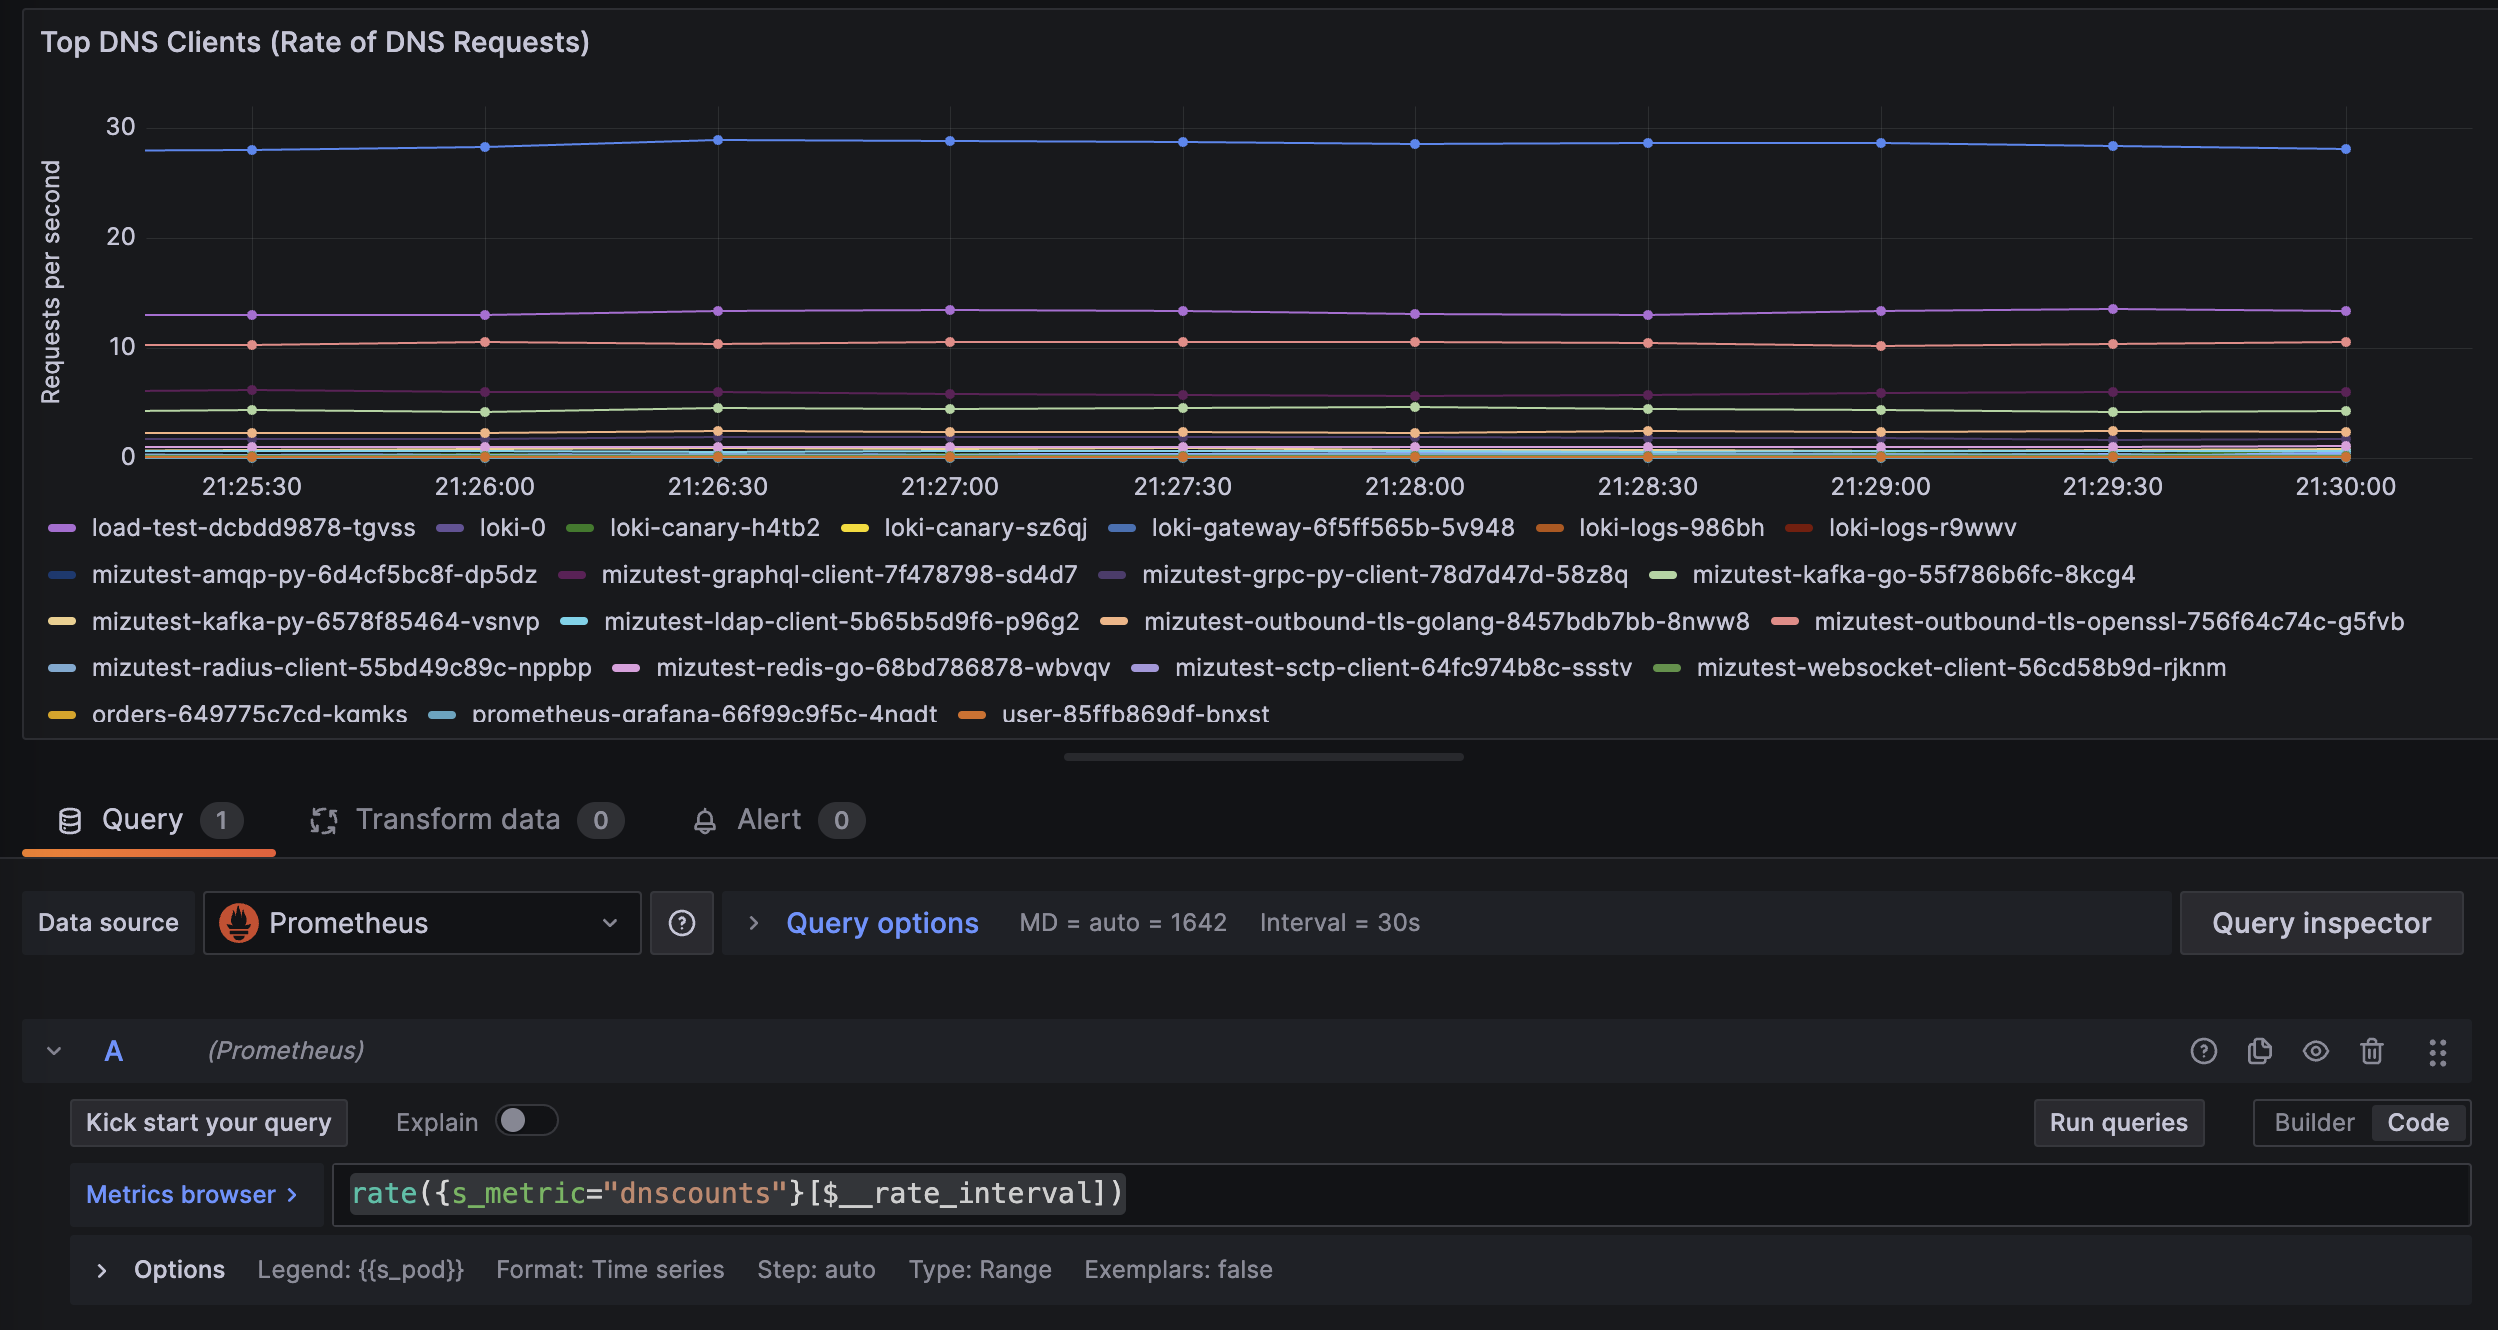
Configuration
By default, Kubeshark uses port 49100 to expose metrics through the service kubeshark-worker-metrics.
If you are using the kube-prometheus-stack community Helm chart, you can configure additional scraping for Kubeshark using the following configuration:
prometheus:
  enabled: true
  prometheusSpec:
    additionalScrapeConfigs: |
      - job_name: 'kubeshark-worker-metrics'
        kubernetes_sd_configs:
          - role: endpoints
        relabel_configs:
          - source_labels: [__meta_kubernetes_pod_name]
            target_label: pod
          - source_labels: [__meta_kubernetes_pod_node_name]
            target_label: node
          - source_labels: [__meta_kubernetes_endpoint_port_name]
            action: keep
            regex: ^metrics$
          - source_labels: [__address__, __meta_kubernetes_endpoint_port_number]
            action: replace
            regex: ([^:]+)(?::\d+)?
            replacement: $1:49100
            target_label: __address__
          - action: labelmap
            regex: __meta_kubernetes_service_label_(.+)
Existing Metrics
Existing metrics provide essential insights for monitoring Kubeshark.
For the most up-to-date details, visit the metrics section in the repository.
Available Metrics
| Name | Type | Description |
|---|---|---|
| kubeshark_received_packets_total | Counter | Total number of packets received |
| kubeshark_dropped_packets_total | Counter | Total number of packets dropped |
| kubeshark_processed_bytes_total | Counter | Total number of bytes processed |
| kubeshark_tcp_packets_total | Counter | Total number of TCP packets |
| kubeshark_dns_packets_total | Counter | Total number of DNS packets |
| kubeshark_icmp_packets_total | Counter | Total number of ICMP packets |
| kubeshark_reassembled_tcp_payloads_total | Counter | Total number of reassembled TCP payloads |
| kubeshark_matched_pairs_total | Counter | Total number of matched pairs |
| kubeshark_dropped_tcp_streams_total | Counter | Total number of dropped TCP streams |
| kubeshark_live_tcp_streams | Gauge | Number of live TCP streams |
Ready-to-use Dashboard
You can import a ready-to-use dashboard from Grafana’s Dashboards Portal.
TL;DR
Metric
A time-series data stream identified by a name and a set of key-value pairs (called labels). Supported metric types:
- Counter: A cumulative value that only increases (e.g., number of requests).
- Gauge: A value that can increase or decrease (e.g., memory usage).
- Untyped: A metric that does not strictly conform to the semantics of other metric types and is essentially a floating-point value (float64).
Example of a metric:
http_requests_total{method="POST", handler="/api"}http_requests_totalis the metric name.{method="POST", handler="/api"}are the labels.
Install Prometheus Community Version
helm upgrade -i prometheus prometheus-community/kube-prometheus-stack \
--namespace prometheus --create-namespace \
-f kube_prometheus_stack.yaml

kubectl port-forward -n prometheus svc/prometheus-grafana 8080:80
Example kube_prometheus_stack.yaml file:
grafana:
  additionalDataSources: []
prometheus:
  prometheusSpec:
    scrapeInterval: 10s
    evaluationInterval: 30s
    additionalScrapeConfigs: |
      - job_name: 'kubeshark-worker-metrics'
        kubernetes_sd_configs:
          - role: endpoints
        relabel_configs:
          - source_labels: [__meta_kubernetes_pod_name]
            target_label: pod
          - source_labels: [__meta_kubernetes_pod_node_name]
            target_label: node
          - source_labels: [__meta_kubernetes_endpoint_port_name]
            action: keep
            regex: ^metrics$
          - source_labels: [__address__, __meta_kubernetes_endpoint_port_number]
            action: replace
            regex: ([^:]+)(?::\d+)?
            replacement: $1:49100
            target_label: __address__
          - action: labelmap
            regex: __meta_kubernetes_service_label_(.+)