Traffic Recorder
Getting Started Quickly
To start a recording job quickly and seamlessly, follow these steps:
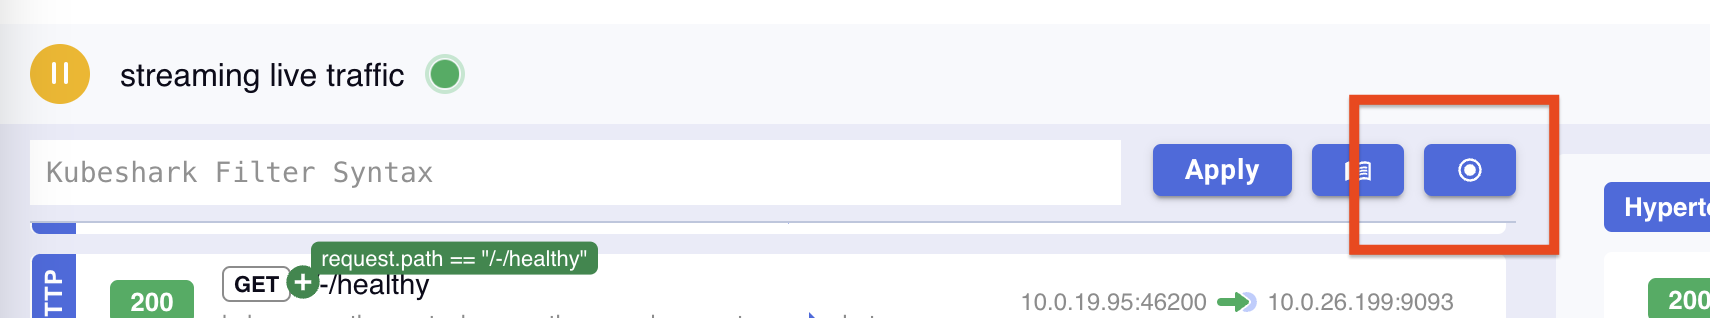
- Click the recording button located next to the KFL statement box.
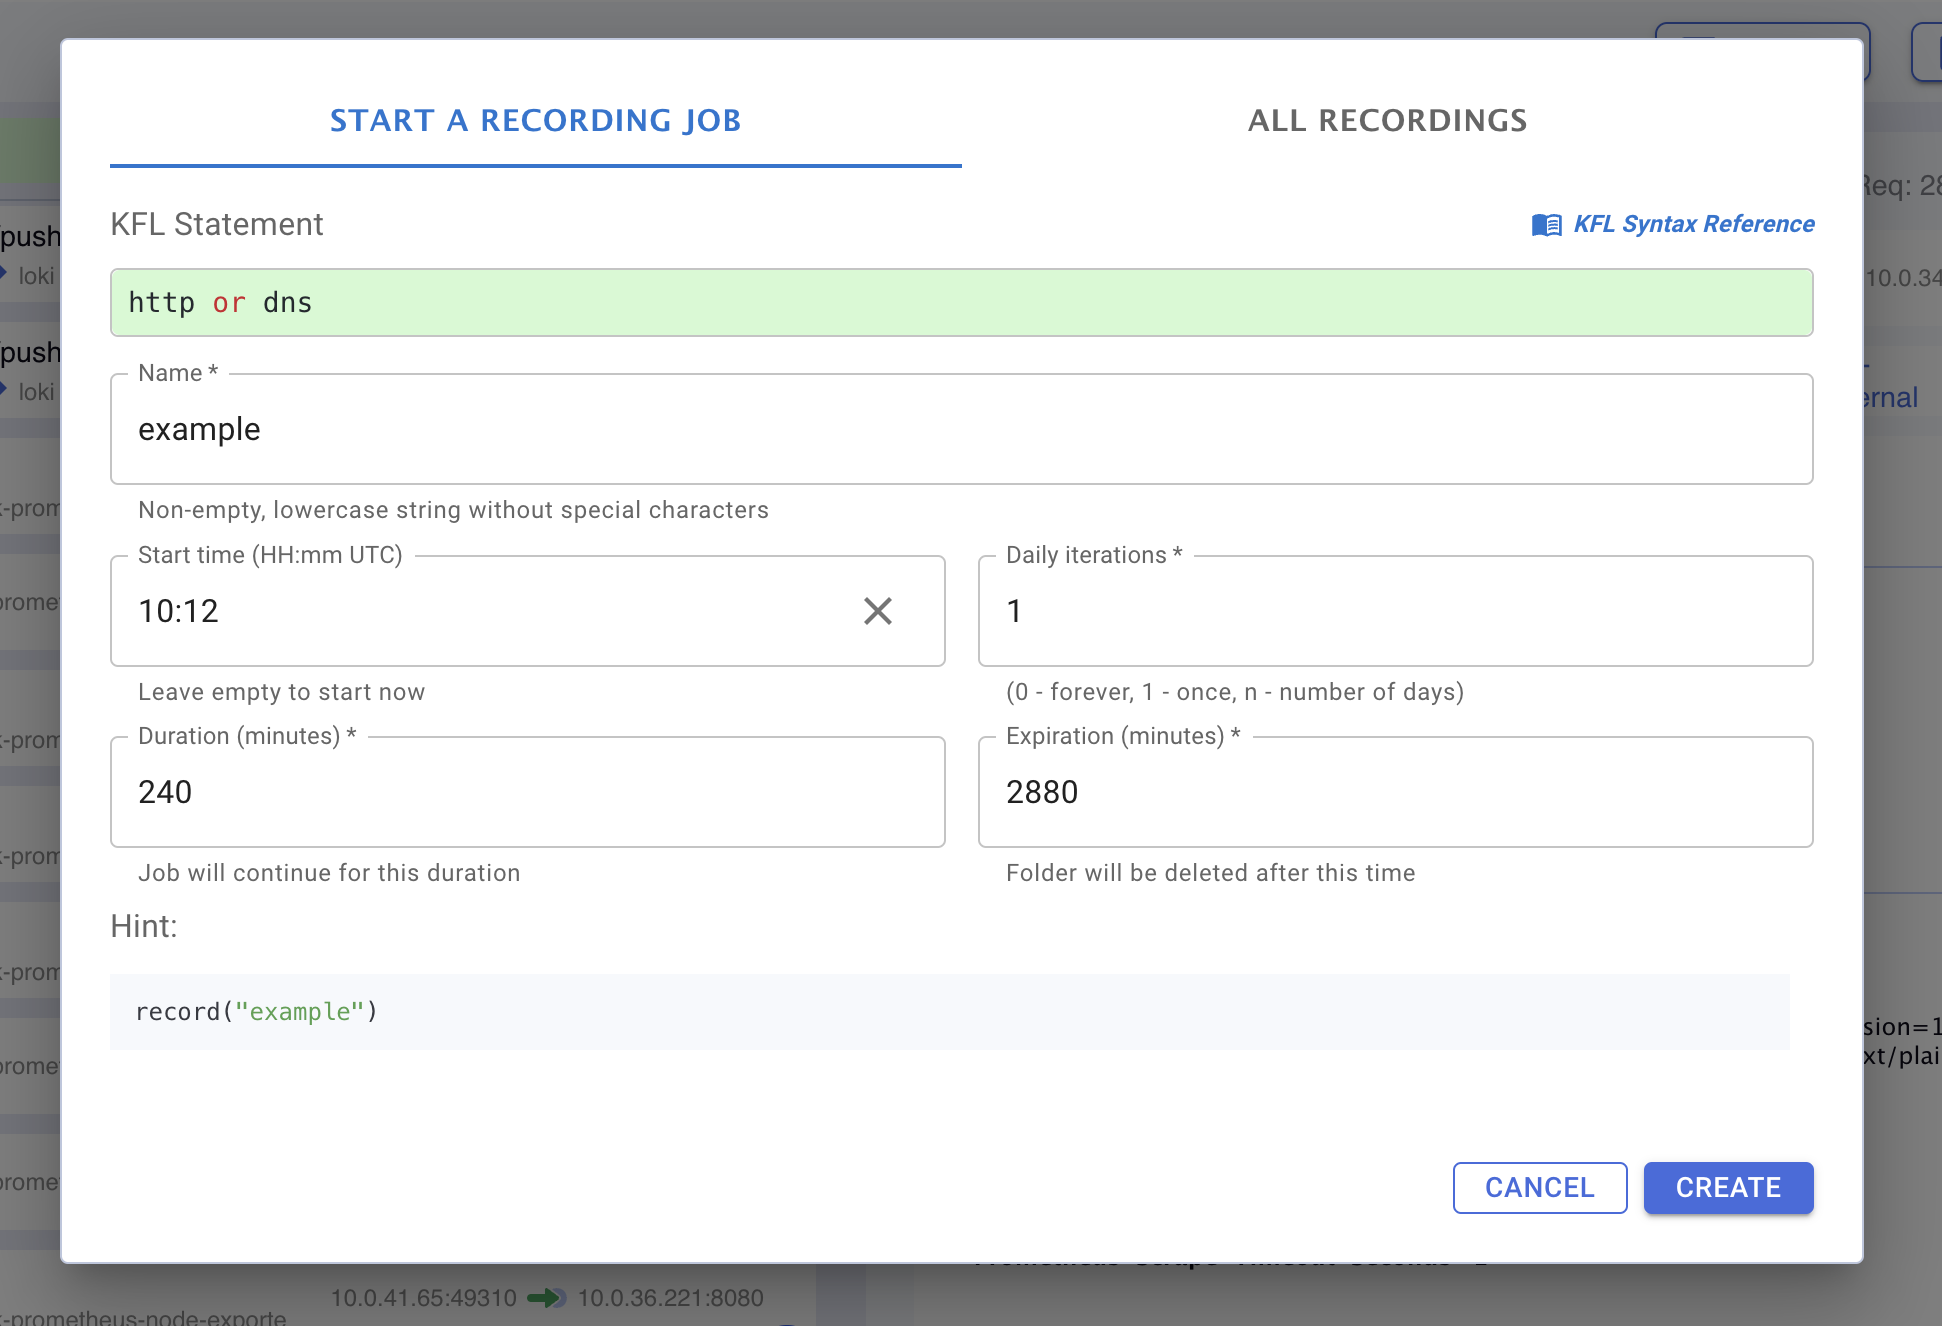
- Ensure the
Start Timefield is empty. If it’s not, click theXto clear it. This will start the recording immediately. - Click CREATE.
- Wait a few minutes, then return to the recording dialog to view the captured traffic.
The default Kubeshark configuration is not optimized for the Traffic Recorder, especially in busy clusters. For best results, review the configuration section.
The Traffic Recorder supports multiple concurrent recording jobs. Each job captures traffic independently, based on a specific KFL statement and schedule. Recordings can be filtered and analyzed using Kubeshark’s advanced query language.
Recording Job Properties
Configure recording job settings in the recording dialog window using the following parameters:
| Property | Example Values | Description |
|---|---|---|
| KFL Statement | http or dns | The KFL pattern used to filter and record traffic. |
| Name | my_recording_no_15 | The name of the job and the corresponding folder. Used to retrieve data. |
| Start Time | 08:45 UTC or leave empty | Scheduled start time in UTC. Leave empty to start immediately. |
| Daily Iterations | 1 (once), 0 (forever), n (days) | Number of days the job should run. Use 1 for once or 0 to run forever. |
| Duration | 60, 1440 | Duration in minutes to record traffic after the job starts. |
| Expiration | 1440, 4320 | Time in minutes before the recording folder is deleted to free storage. |
Behavior-Based Recording
KFL statements can filter traffic by Kubernetes attributes (e.g., pods, namespaces) and behavior. For example:
(response.status == 500) and
(request.headers["User-Agent"] == "kube-probe/1.27+") and
(src.name == "kube-prometheus-stack-prometheus-node-exporter")
This captures L4 streams for API traffic that meets specific criteria, such as being initiated by a known service and returning HTTP status code 500.
Troubleshooting & Configuration Tuning
By default, Kubeshark is optimized for real-time traffic viewing in small clusters. However, the Traffic Recorder requires tuning for performance in busy or large-scale environments. Incorrect configuration can lead to Worker pod eviction and loss of PCAP data.
Signs of Misconfiguration
Eviction
The tap.storageLimit default is 500Mi. When exceeded, the Worker pod is evicted, its storage is purged, and it is restarted.
Large volumes of PCAP or JSON data can exceed this limit quickly, especially in busy clusters. Once evicted, all recorded data is lost, and the recording will appear empty.
Suggested Configuration Values
Tuning depends on your available resources and traffic volume. Below is a sample configuration—feel free to increase values as needed for your environment.
--set tap.storageLimit=5Gi --set tap.misc.pcapTTL=30sor as YAML:
tap:
  misc:
    pcapTTL: 30s
  storageLimit: 5Gi
There’s no need to adjust JSON TTL settings for the Traffic Recorder to function effectively.