Take a cluster-wide PCAP snapshot
You can take a cluster-wide traffic snapshot based on the pcapdump configuration values. By default, Kubeshark allows you to create and download a snapshot of the last 60 minutes of cluster-wide traffic. This functionality is available through the recording dialog window.
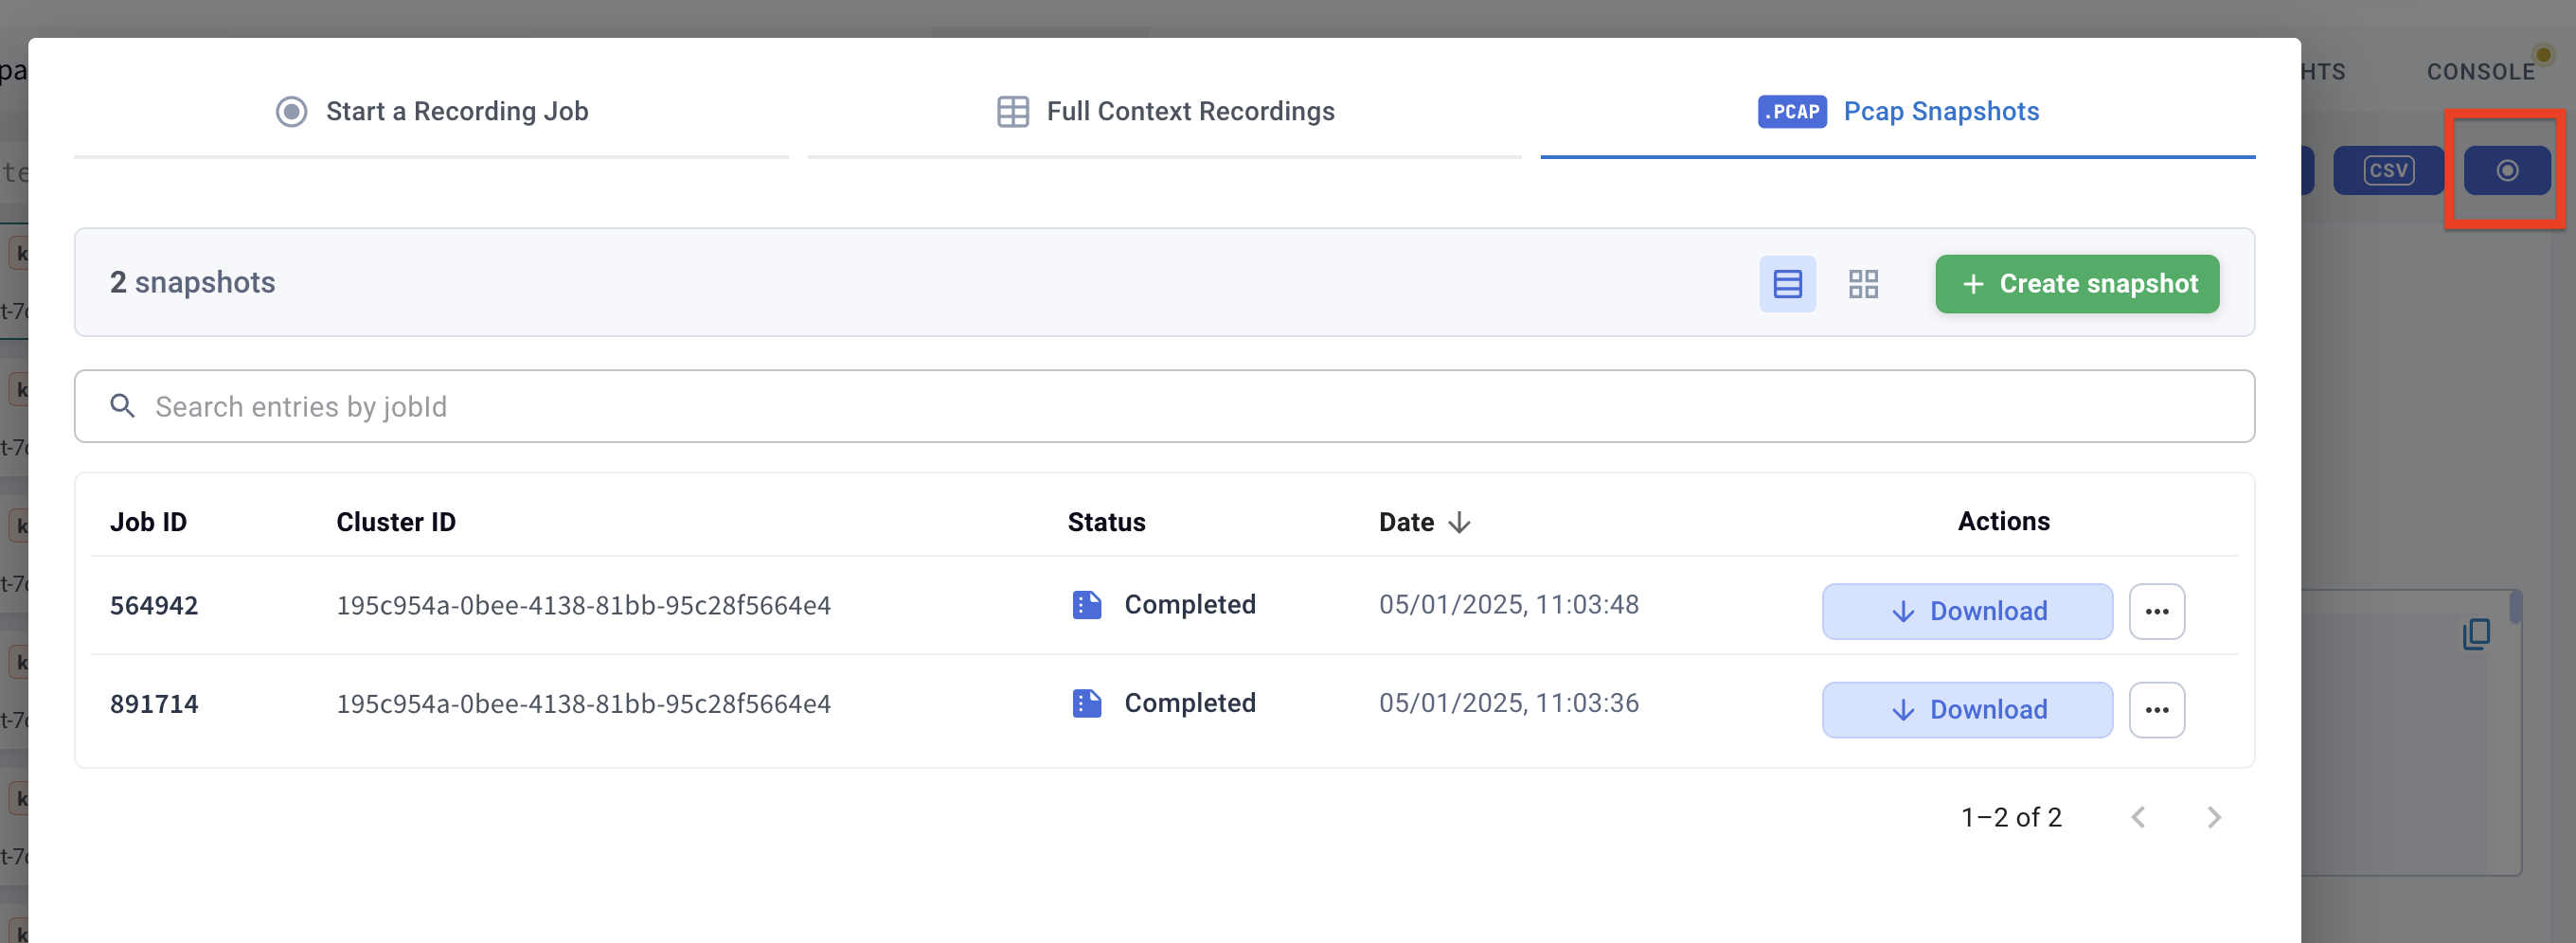
The snapshot includes all Layer 4 (L4) supported protocols—such as TCP, UDP, and SCTP—including decrypted TLS and mTLS traffic. This functionality is similar to the popular tcpdump.
Kubeshark automatically and continuously captures and stores traffic while managing both time window and storage constraints. This allows you to export recorded traffic to a local folder at any time for retention or further analysis using Wireshark.
Configuration Options
See the Capture Filters section to learn more about how to set proper capture filters.
Specific traffic snapshot (pcapdump) properties can be set in the settings section or in the Helm values.
Kubeshark handles retention automatically by deleting old files outside the defined time window or beyond the allocated storage quota.
For example, with a 24-hour time window and a 50 MB storage limit, Kubeshark retains only the files recorded in the last 24 hours and within the 50 MB cap. Older or excess files are removed automatically.
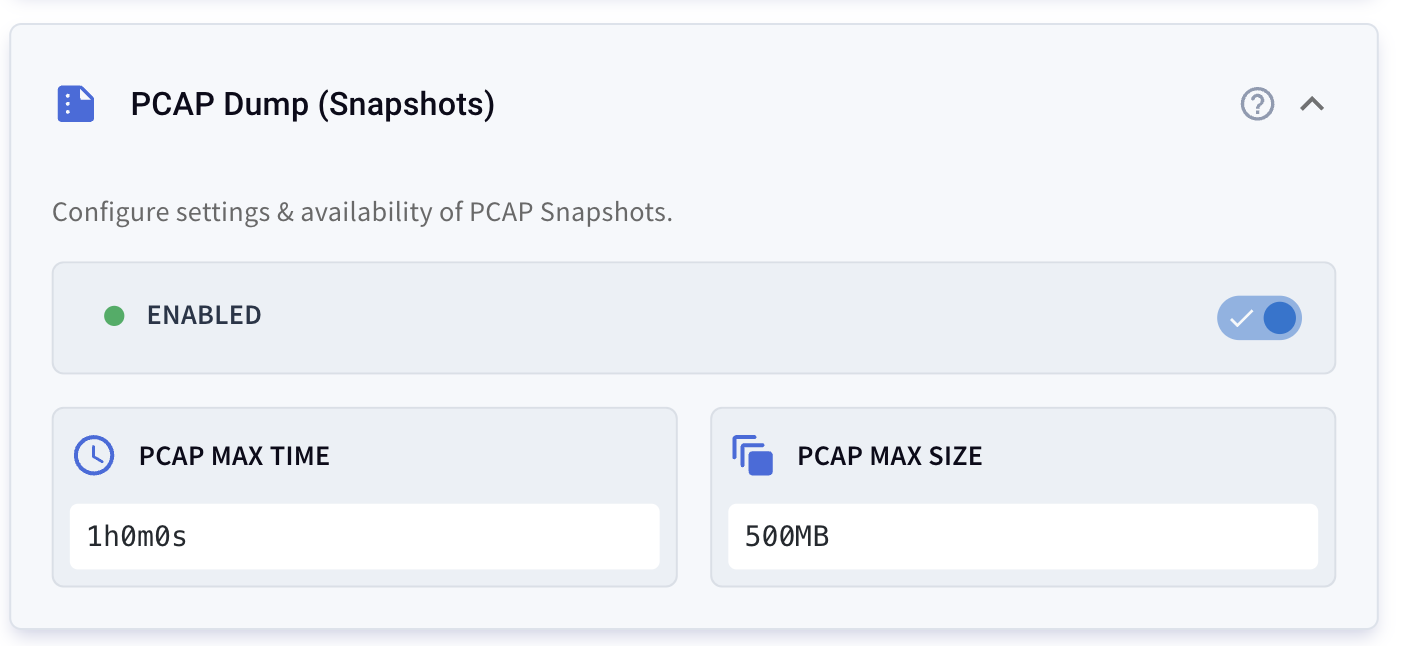
Example pcapdump configuration:
pcapdump:
  enabled: true                 # Enable or disable PCAP recording
  maxTime: 1h                   # Time window for retaining PCAP files
  maxSize: 50MB                 # Maximum storage size for PCAP files
CLI Installation
You can also take traffic snapshots using the Kubeshark CLI.
First, ensure the CLI is installed. You can install it via Homebrew (brew install kubeshark) or other supported methods.
See installation instructions for more options.
Taking a Snapshot
Use the following CLI commands to export recorded traffic:
kubeshark pcapdump --dest=/tmp             # Export all PCAP files to /tmp
kubeshark pcapdump --dest=/tmp --time=5m   # Export only the last 5 minutes to /tmp
kubeshark pcapdump                         # Export all PCAP files to the current directory
kubeshark pcapdump --time=5m               # Export the last 5 minutes to the current directory
The
kubesharkCLI is available via Homebrew or can be downloaded from GitHub.
Each command produces a single .pcap file saved to the specified directory (or the current one, if no destination is set).