Troubleshooting
Kubeshark installation aims to be straightforward, but due to the diverse range of Kubernetes (K8s) versions and configurations, some troubleshooting may be required.
Troubleshooting
No Data Displayed for Specific Pods
If no data is shown, validate pod targeting. Common root causes include:
- The pod is no longer running.
- No Worker is present on the node hosting the pod.
- Pod targeting filters are excluding the pod.
- Confirm that the Worker is active on the node and running correctly.
- Restart the Worker if necessary.
- Review logs for relevant errors or warnings.
Pod is Targeted but No Data is Displayed
Potential causes include Worker malfunction, traffic capture issues, or protocol parsing limitations.
- Check for traffic visibility on the node. If none appears, restart the Worker.
- Enable protocol dissectors (e.g., TCP) to validate packet inspection.
- Determine whether the traffic is encrypted, which may limit visibility.
I Don’t See the Traffic I’m Looking For
Use the tcp dissector to see all TCP traffic. If the traffic isn’t visible, Kubeshark isn’t capturing it for some reason (e.g., capture filters).
Examine the traffic dumped and recorded by Kubeshark. If the traffic you’re looking for isn’t there, it might be a permission or network policy issue.
I Don’t See HTTP/2 Traffic
HTTP/2 sometimes runs on long-lived connections. Kubeshark must start processing the traffic before the long-lived connection is established. It cannot process an existing long-lived connection. This can happen if you start Kubeshark after the long-lived connection has already been established.
To see the raw TCP and possibly the HTTP/2 packets, use the tcp dissector.
I Don’t See HTTPS/TLS Traffic
If you’re not seeing the SSL/TLS traffic you expect, there could be two issues:
- The TLS connection started before the Workers started. Kubeshark cannot tap into an ongoing TLS connection; it needs to process the handshake to show (un)encrypted traffic in clear text.
- The SSL library or method isn’t supported. There are numerous SSL/TLS libraries and methods used to encrypt and decrypt traffic. Kubeshark uses eBPF with specific method implementations to support the most common ones. You can read more about how Kubeshark processes TLS traffic in the TLS/HTTPS (eBPF) section.
Even if, for any reason, Kubeshark cannot display the (un)encrypted traffic in clear text, you can still view the encrypted traffic within the Kubernetes context. To see the raw TCP and encrypted traffic, use the tcp and/or tls dissectors.
Workers or Hub Get OOMKilled
Frequent OOMKilled errors indicate that the cluster is overburdened relative to the resources allocated to Kubeshark. By default, Kubeshark imposes resource limitations suitable for small dev/test clusters. We recommend either utilizing capture filters or increasing resource limitations, or preferably both. Consult our performance page for guidance on optimizing resource consumption.
Worker Pods Get Evicted
On busy clusters, the Worker pods can quickly consume the default 5GB storage limit, leading to pod eviction and restarts. This issue can be exacerbated if you’re recording traffic, as more files are stored for longer retention periods.
If storage exceeds its limit, the pod is evicted. The storage limit is controlled by setting the tap.storageLimit configuration value. To increase this limit, provide a different value (e.g., setting it to 50GB with --set tap.storagelimit=50Gi).
Another alternative is to not store PCAP files by setting pcapTTL and pcapErrorTTL to zero. This can also be useful if the PCAP files are of no interest.
--set tap.storageLimit=50Gi
--set tap.misc.pcapTTL=0
--set tap.misc.pcapErrorTTL=0
Remember also that if you continuously dump PCAP traffic using the pcapdump utility, it also consumes storage.
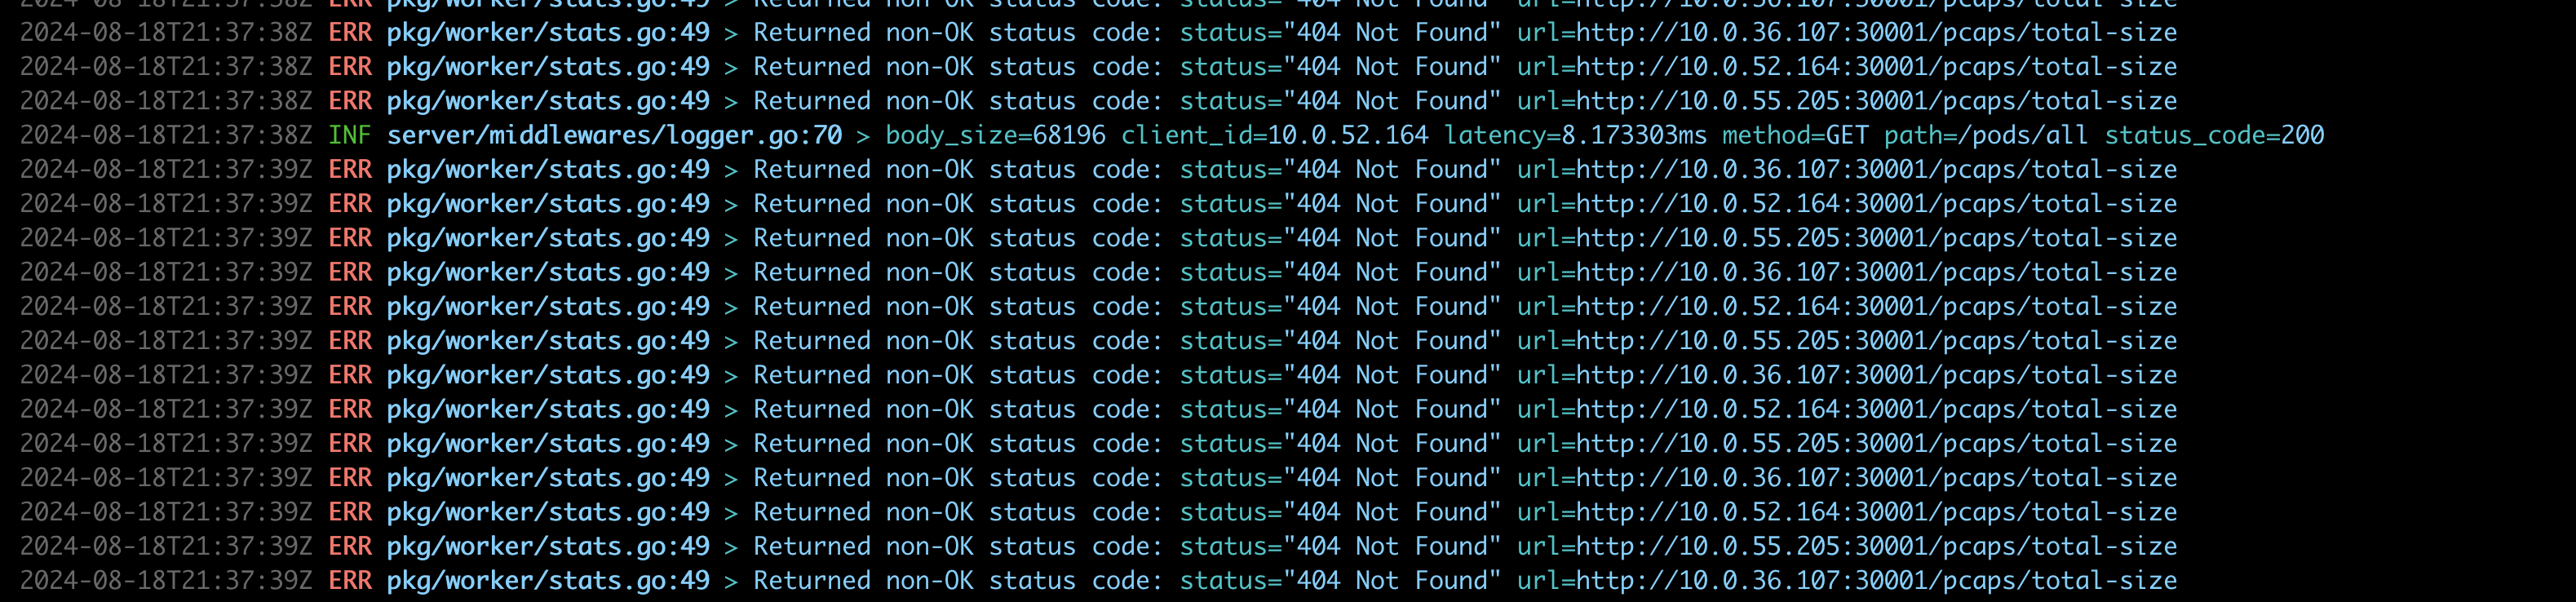
I Don’t See Traffic in the Dashboard, and the Counters Are Zero

If everything seems to be working but the dashboard is empty and the bottom counters are stuck at zero, it could mean one of the following:
- No connection between the Hub and the Workers
- The Workers are in a crash loop
- The ports the Workers are listening on are occupied (this is the most common issue)
If the Workers appear to be functioning and are not in a crash loop, it is likely an issue with occupied ports. The Hub’s logs should indicate the problem.
This can be resolved by changing the Worker port:
tap:
  proxy:
    worker:
      srvPort: 30001
    hub:
      srvPort: 8898
    front:
      port: 8899
    host: 127.0.0.1
Port-Forward is Failing
When deploying Kubeshark using the CLI, the port-forward can fail. Such failures should be apparent in the console logs:
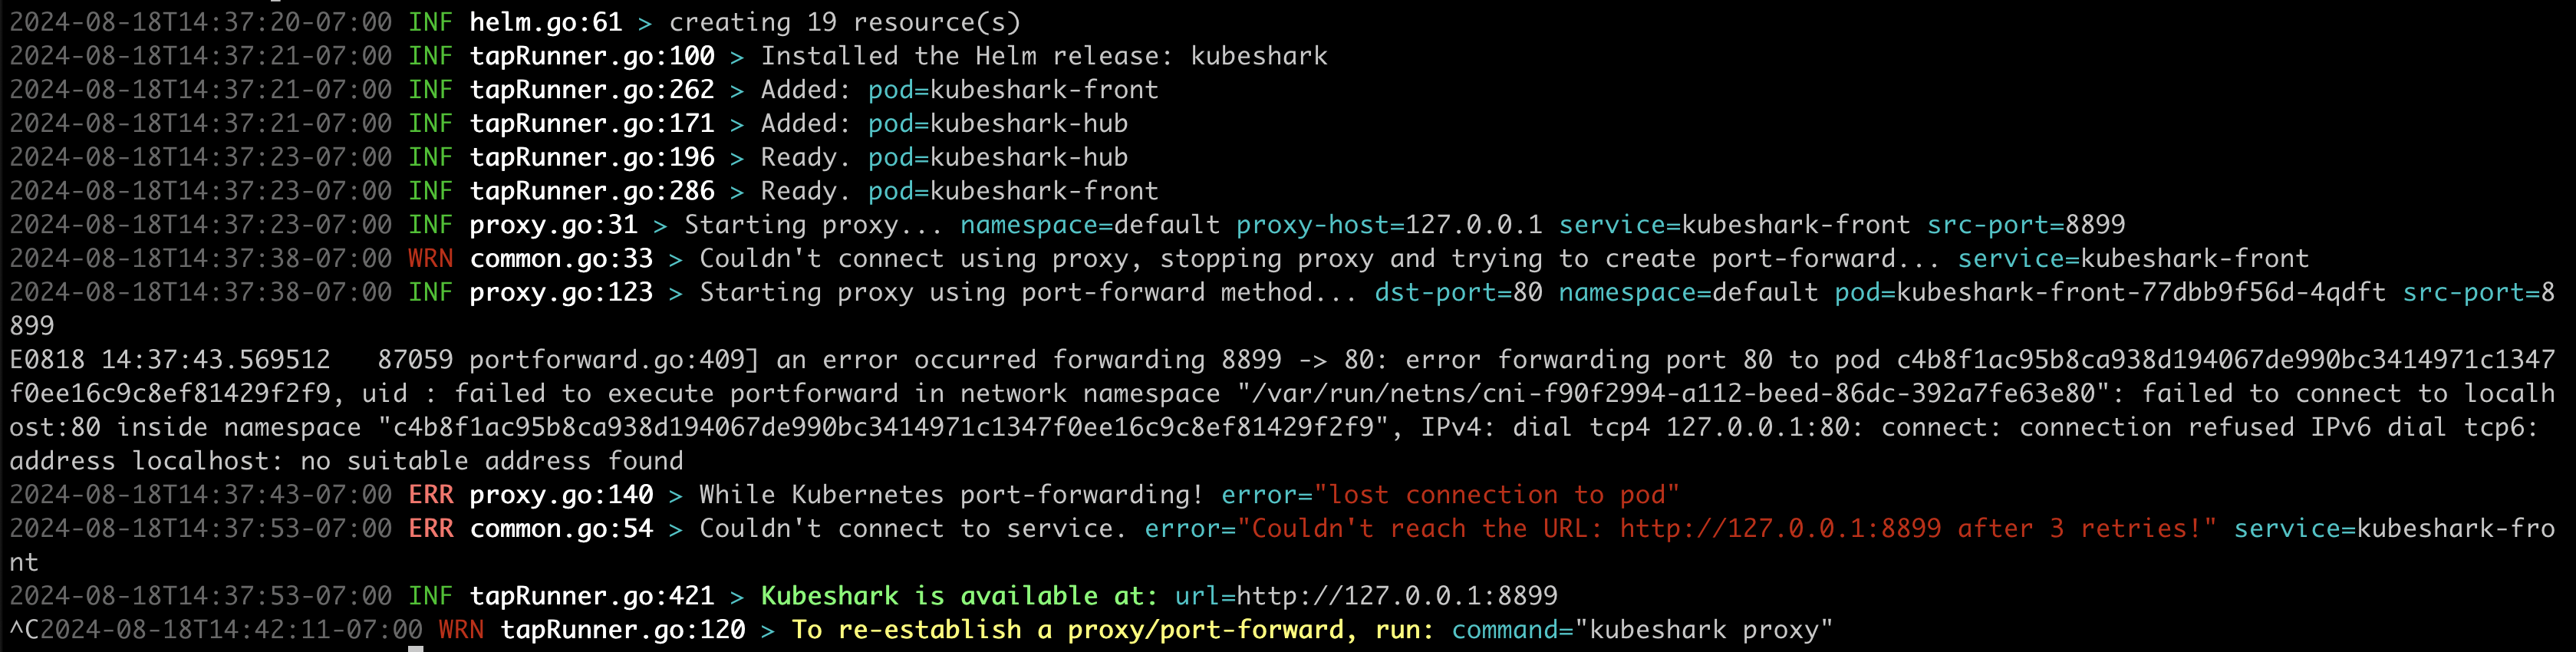
This can be fixed by using the port-forward command manually:
kubectl port-forward svc/kubeshark-front 8899:80High Volume of Kubeshark-Related Audit Log Events
Some users have reported a surge in audit log events following Kubeshark installation, as discussed in issue #1500. Although this behavior was not replicated in our test environments, it is crucial to address if experienced. Reducing Kubeshark-related audit log volumes can be achieved by disabling auditing for specific events as shown below:
  - level: None
    userGroups: ["system:serviceaccounts"]
    users: ["system:serviceaccount:default:kubeshark-service-account"]
Well, That Didn’t Work
If the provided solutions do not resolve your issue, other resources are available to assist you promptly:
- Report a bug by creating a GitHub ticket.
- Join our Slack channel for community support. We strive to be responsive and helpful.
- Contact the project team directly for dedicated and timely assistance.