Send Metrics to InfluxDB
Kubeshark enables you to send metrics directly to any InfluxDB local instance or cloud-hosted solution using the InfluxDB helper. You can then use InfluxDB’s capabilities as a time-series database for reporting and further aggregation (e.g. to Grafana).
Sending Identity-aware Latency Information
The following example utilizes the onItemCaptured hook and calls vendor.influxdb to send latency and status-code data to an InfluxDB instance on every API call. In addition to the latency and status metrics, each message includes the service, path and namespace as tags to enable easy filtering in InfluxDB.
function onItemCaptured(data) {
  if (data.protocol.name !== "http") return;  // ignore non-HTTP traffic

  vendor.influxdb(
    env.INFLUXDB_URL,
    env.INFLUXDB_TOKEN,
    "my-org-name",                            // Organization
    "my-bucket-name",                         // Bucket
    "PerformanceKPIs" ,                       // Measurement
    {
      latency:    data.elapsedTime
      status:     data.response.status
    },                                        // Key-Value Metrics
    {
      service:    data.dst.name,
      path:       data.request.path,
      namespace:  data.namespace
    }                                         // Key-Value Tags
  );
}
The example assumes the key properties that are required for authentication are stored in the Kubeshark’s configuration file as environment variables.
See
vendor.influxdbfor more info.
Read the onItemCaptured hook section to learn more about data that becomes available when using this hook.
Practical Example
Installing a local instance of InfluxDB is pretty straight forward and shouldn’t take more than a few minutes.
Follow the InfluxDB’s documentation to install a local instance or go to InfluxData Website, the company behind InfluxDB to sign up and use a cloud-hosted version.
Install a local Instance
As an example, you can use the following command to install a local instance of InfluxDB on Mac OS and then start it:
brew update
brew install influxdb
influxd
Retrieving the Required Properties
To send a message to your InfluxDB instance you need the following properties:
- InfluxDB URL
- API Token
- Organization
- A bucket
- Measurement
- Metrics: Key-value set
- Tags: Key-value set
Follow the InfluxDB’s documentation to create the following:
- API Token
- Organization
- A bucket
The InfluxDB URL is simply the instance’s URL that can be copied from the browser once you log in to your instance.
The other three properties (e.g. Measurement, Metrics, Tags) can be defined on the run.
While you can created numerous metrics, queries and graphs, some properties are unlikely to change and therefore it is recommended to keep them in the Kubeshark configuration file under the environment variable section.
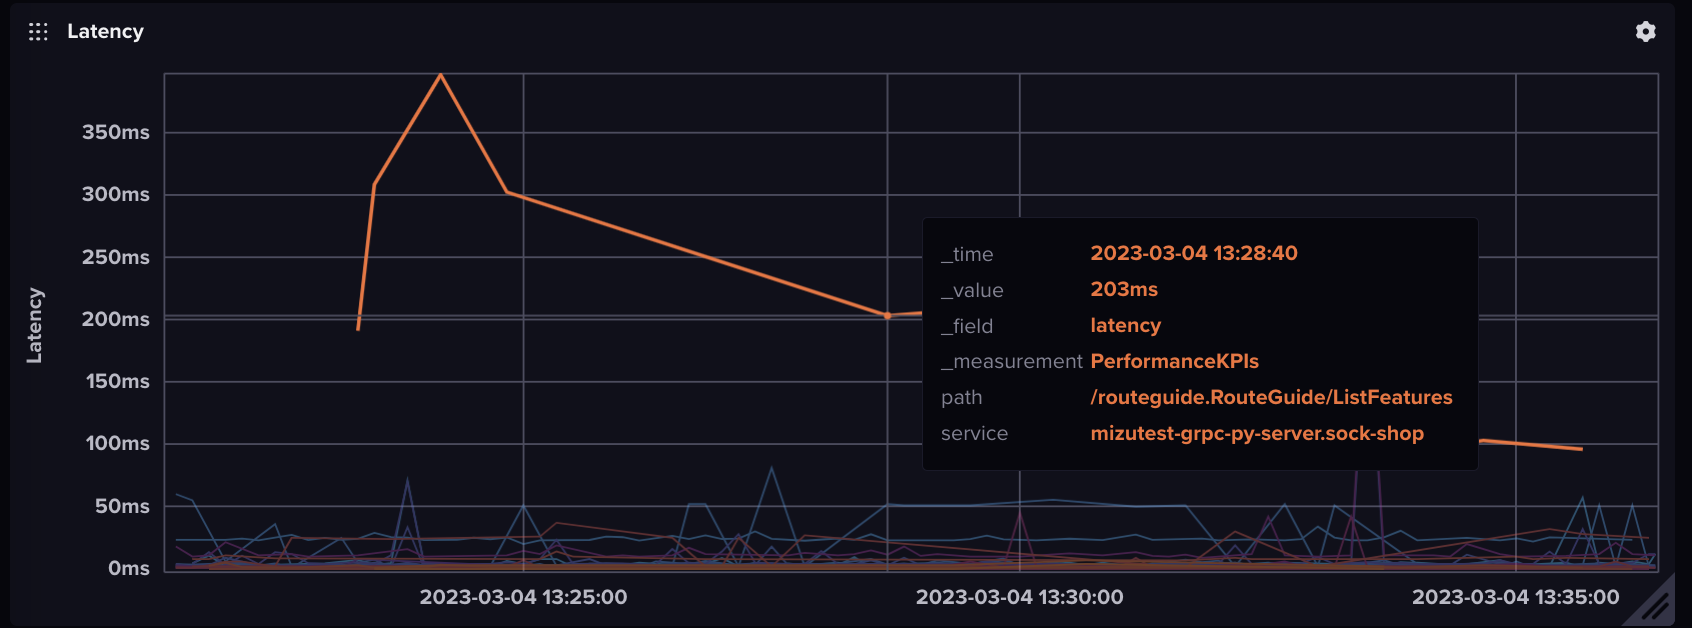
API Call Latency Query and a Graph
This query presents a latency graph for each API call including the service name, the path and namespace of each data point. Having these tags is useful to filter the APIs based on service, path and namespace properties.
from(bucket: "Metrics")
  |> range(start: v.timeRangeStart, stop: v.timeRangeStop)
  |> filter(fn: (r) => r["_measurement"] == "PerformanceKPIs")
  |> filter(fn: (r) => r["_field"] == "latency")
  |> aggregateWindow(every: v.windowPeriod, fn: mean, createEmpty: false)
  |> yield(name: "mean")
This would be the graph resulting from this query:
API Call Status Code Query and a Graph
The following query, which is almost similar to the previous one, uses the data sent using the onItemCaptured hook (see a couple of paragraph above) to present the status code of each API call with the path and service name information included for every data point.
from(bucket: "Metrics")
  |> range(start: v.timeRangeStart, stop: v.timeRangeStop)
  |> filter(fn: (r) => r["_measurement"] == "PerformanceKPIs")
  |> filter(fn: (r) => r["_field"] == "status")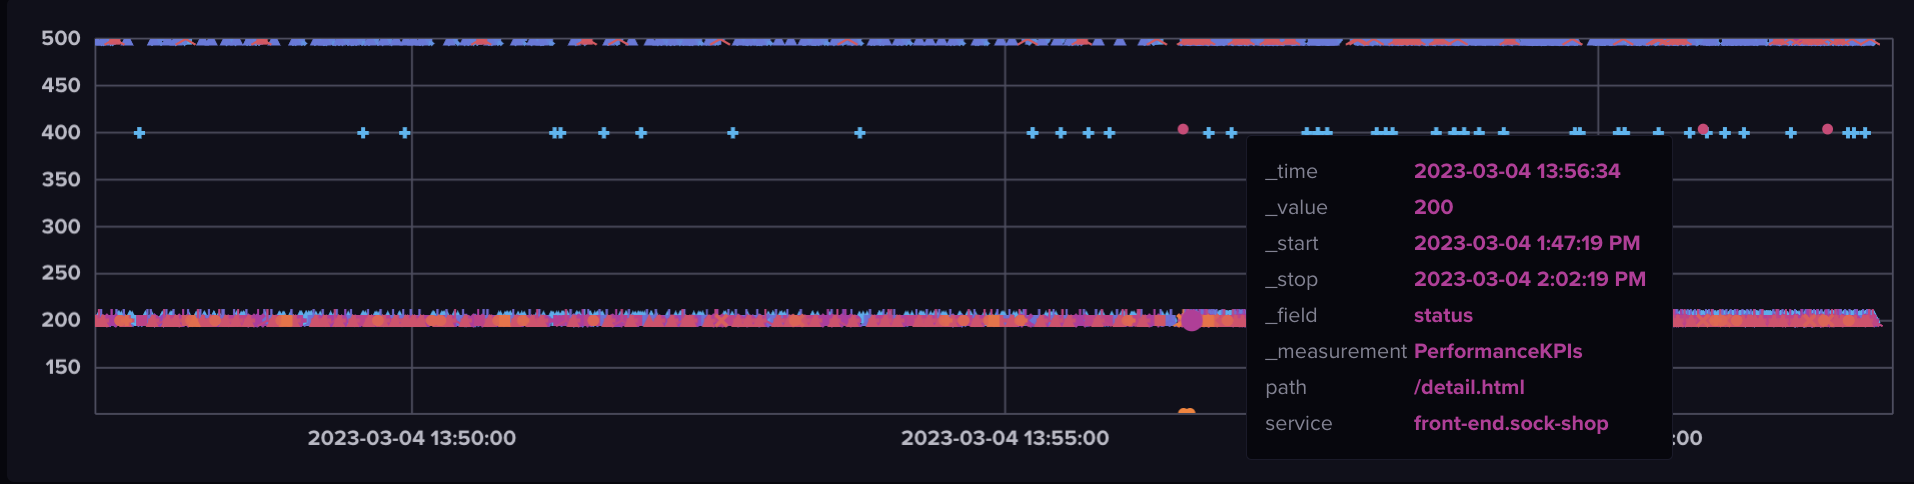
Connecting to Grafana
Metrics that are transmitted to InfluxDB can be aggregated to be used in Grafana, when selecting your InfluxDB instance as a source.
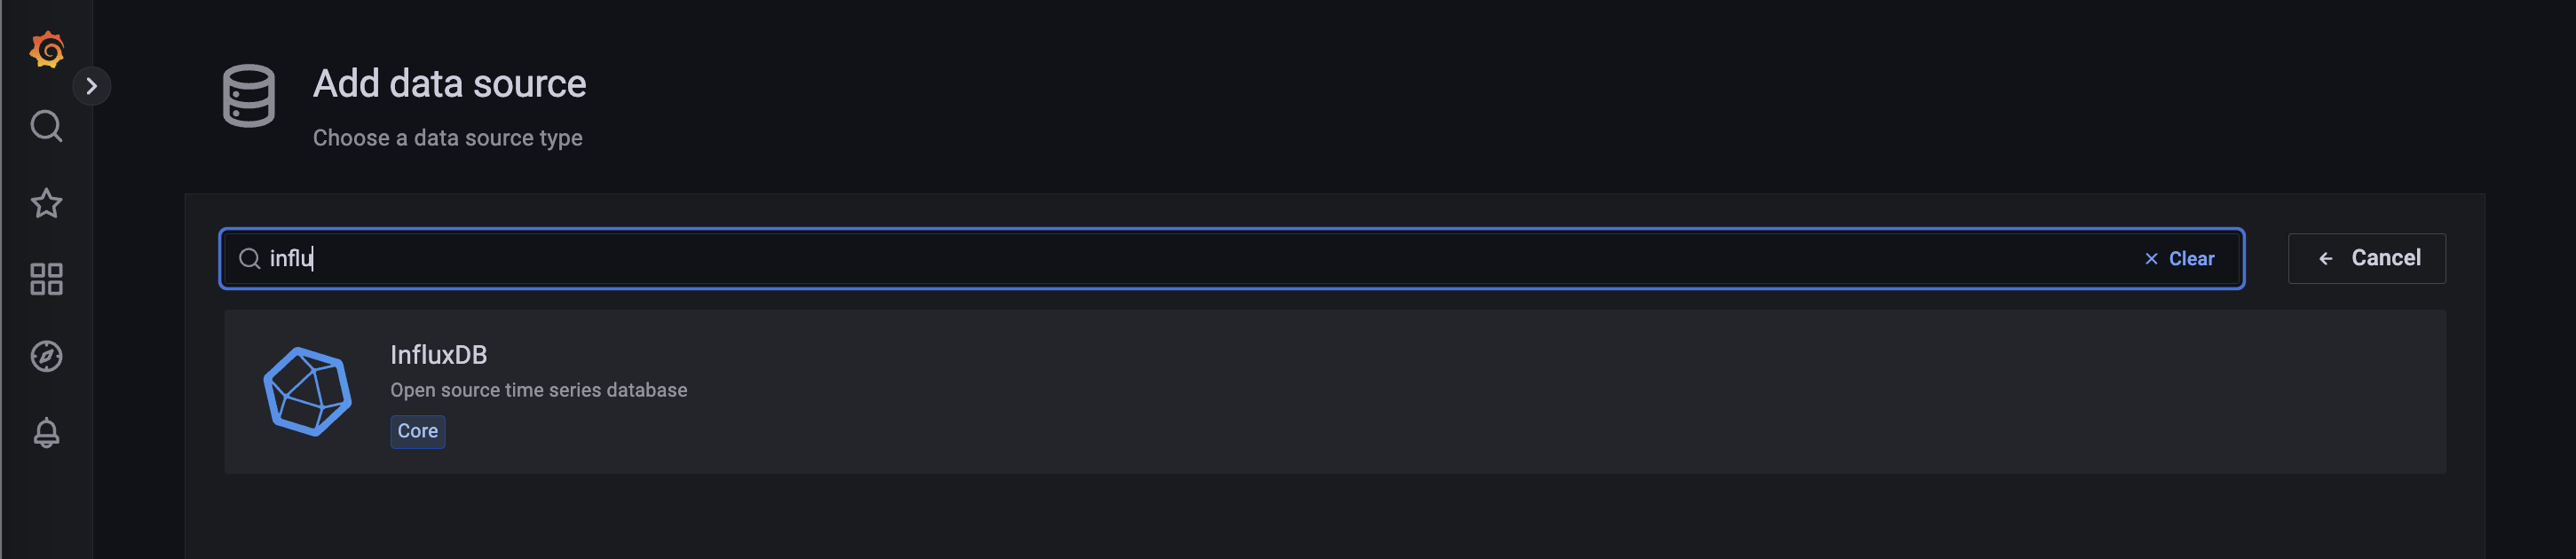
Adding InfluxDB as a Data Source in Grafana
Follow one of these resources to add your InfluxDB instance to Grafana as a data source:
- https://grafana.com/docs/grafana/latest/getting-started/get-started-grafana-influxdb/
- https://www.influxdata.com/blog/getting-started-influxdb-grafana/
Go ahead, copy and paste the query from InfluxDB to Grafana amd continue manipulating the data in Grafana. Below is a snapshot from Grafana after connecting to your InfluxDB instance.
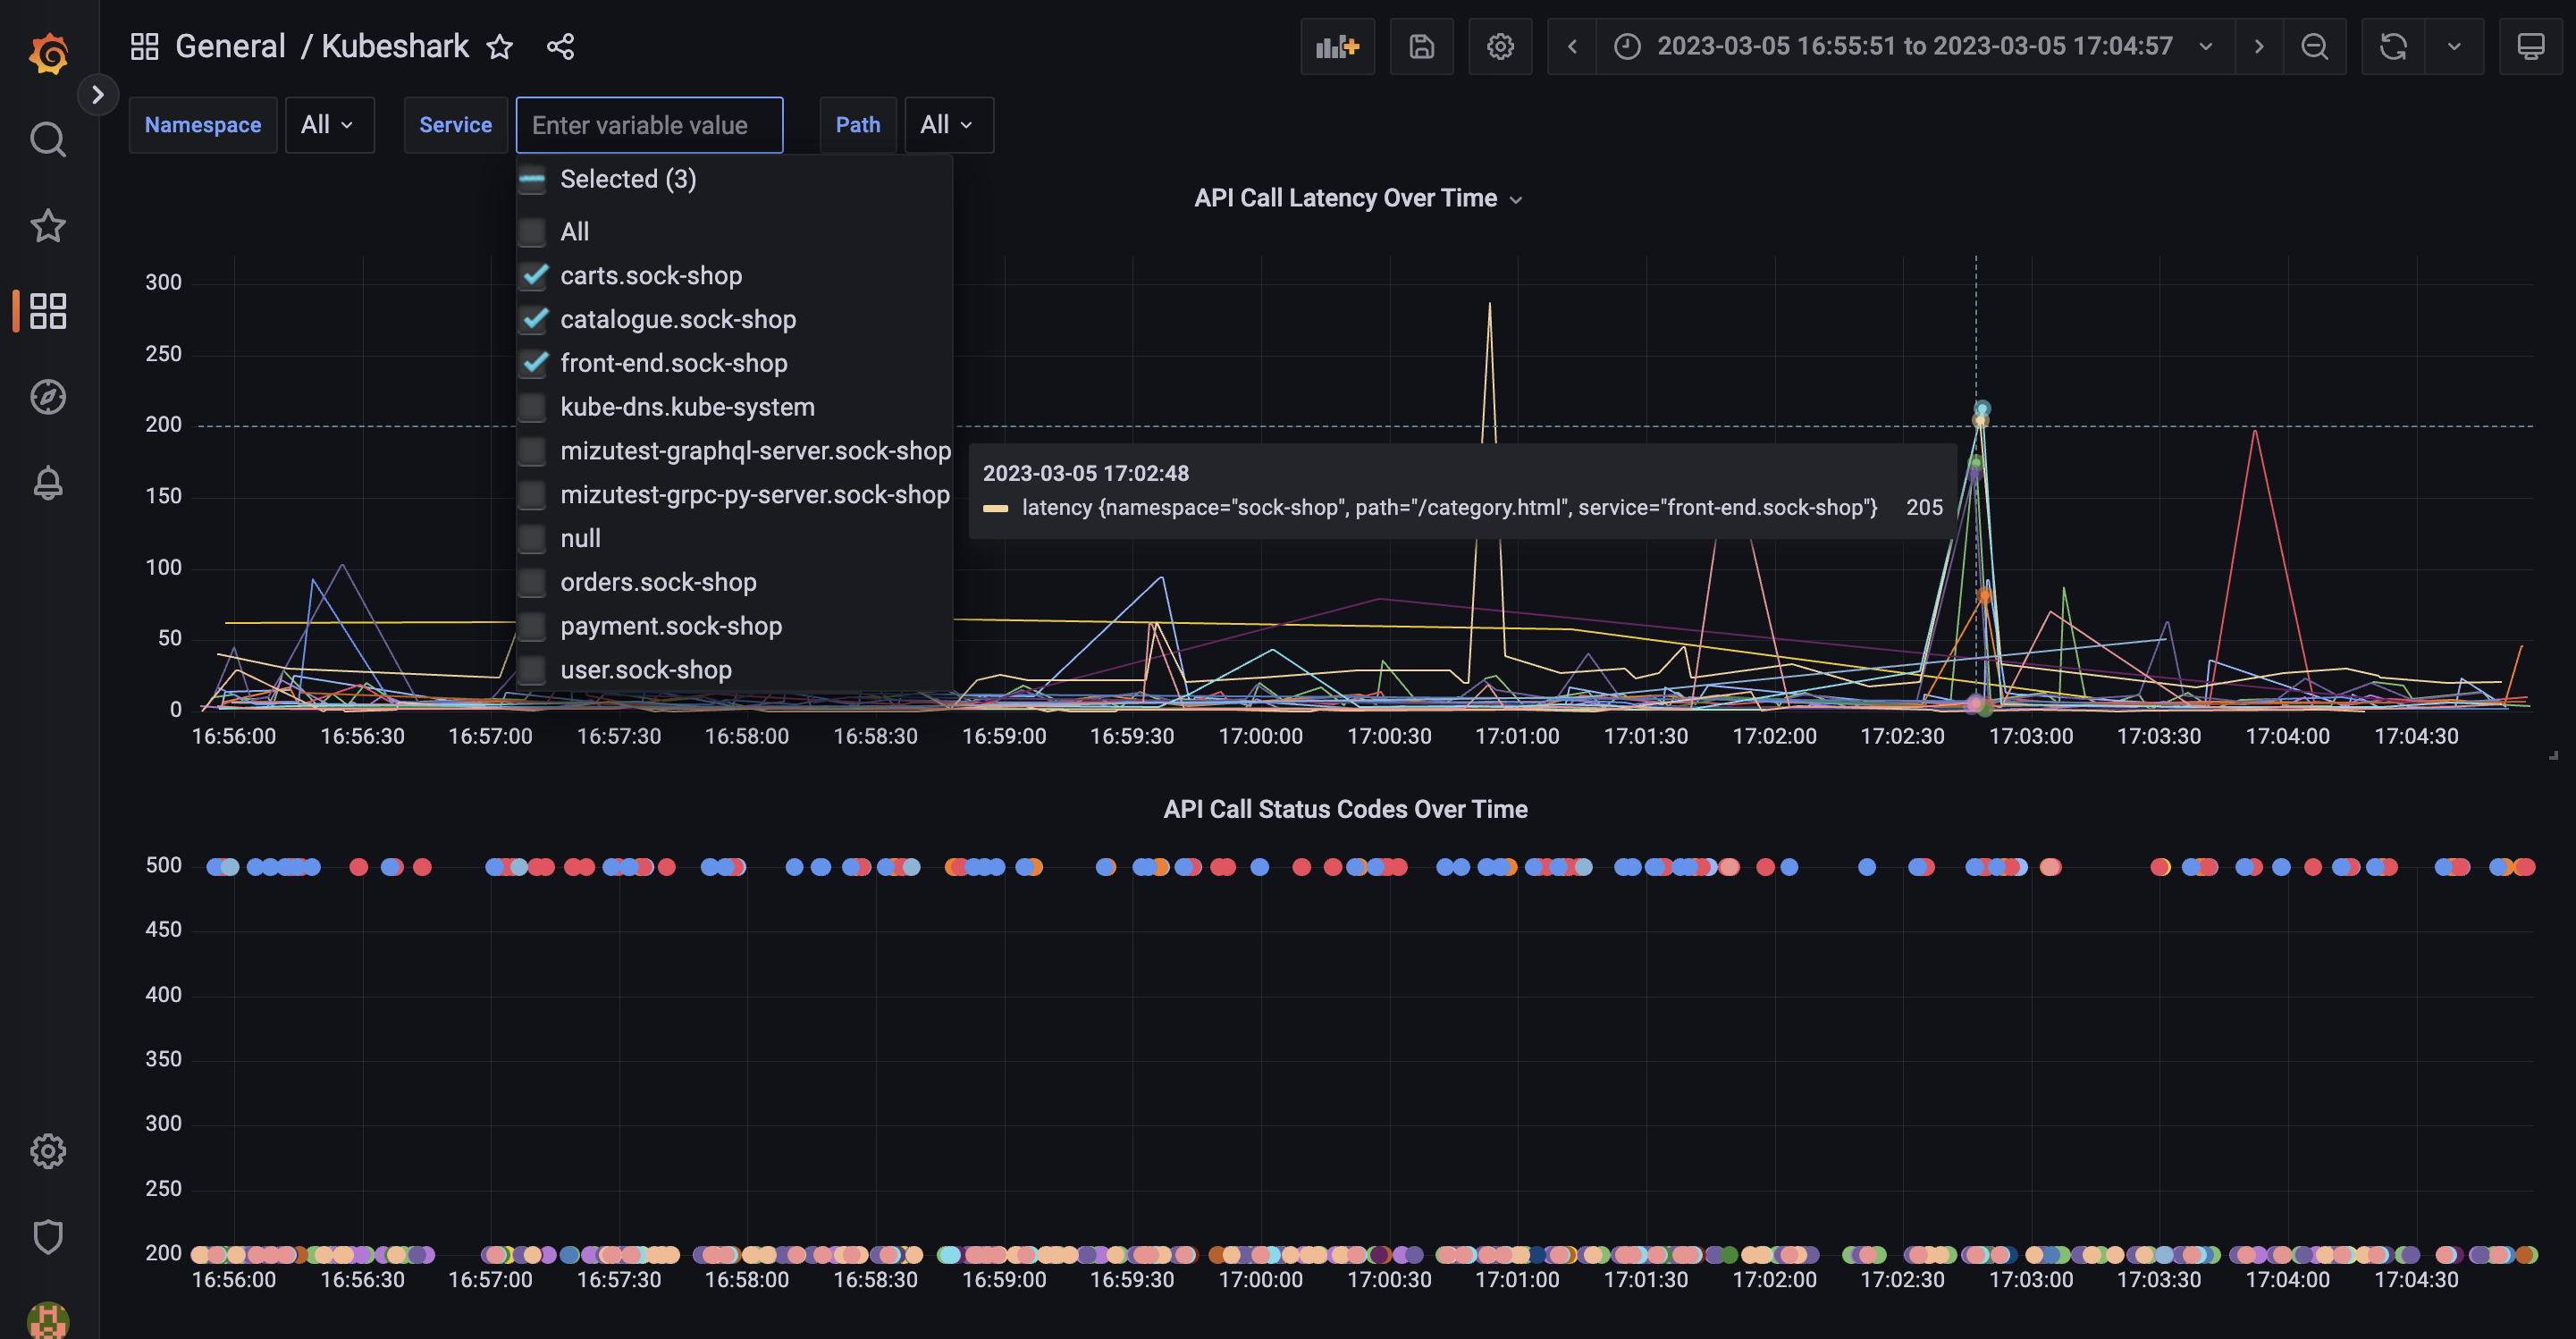
Defining the above chart and form selectors in Grafana is done with this query:
from(bucket: "Metrics")
  |> range(start: v.timeRangeStart, stop: v.timeRangeStop)
  |> filter(fn: (r) => r["_measurement"] == "PerformanceKPIs")
  |> filter(fn: (r) => r["_field"] == "latency")
  |> filter(fn: (r) => contains(value: r["namespace"], set: ${Namespace:json}))
  |> filter(fn: (r) => contains(value: r["service"], set: ${Service:json}))
  |> filter(fn: (r) => contains(value: r["path"], set: ${Path:json}))
  |> aggregateWindow(every: v.windowPeriod, fn: mean, createEmpty: false)
  |> yield(name: "mean")