Network Error Detection & Analysis
Kubeshark is useful for detecting various network-related errors, such as:
- TCP (Connection) Errors
- Timeout Errors
- Packet Loss
- ICMP
- Dissection Errors
- L4 Stream Capture Timeout
- Half Connections
- Error Filter
- Tip: Error Dashboard
In addition to offering details about detected errors, Kubeshark allows you to record raw traffic for in-depth analysis using tools such as Wireshark
Learn more in the Traffic Recorder section.
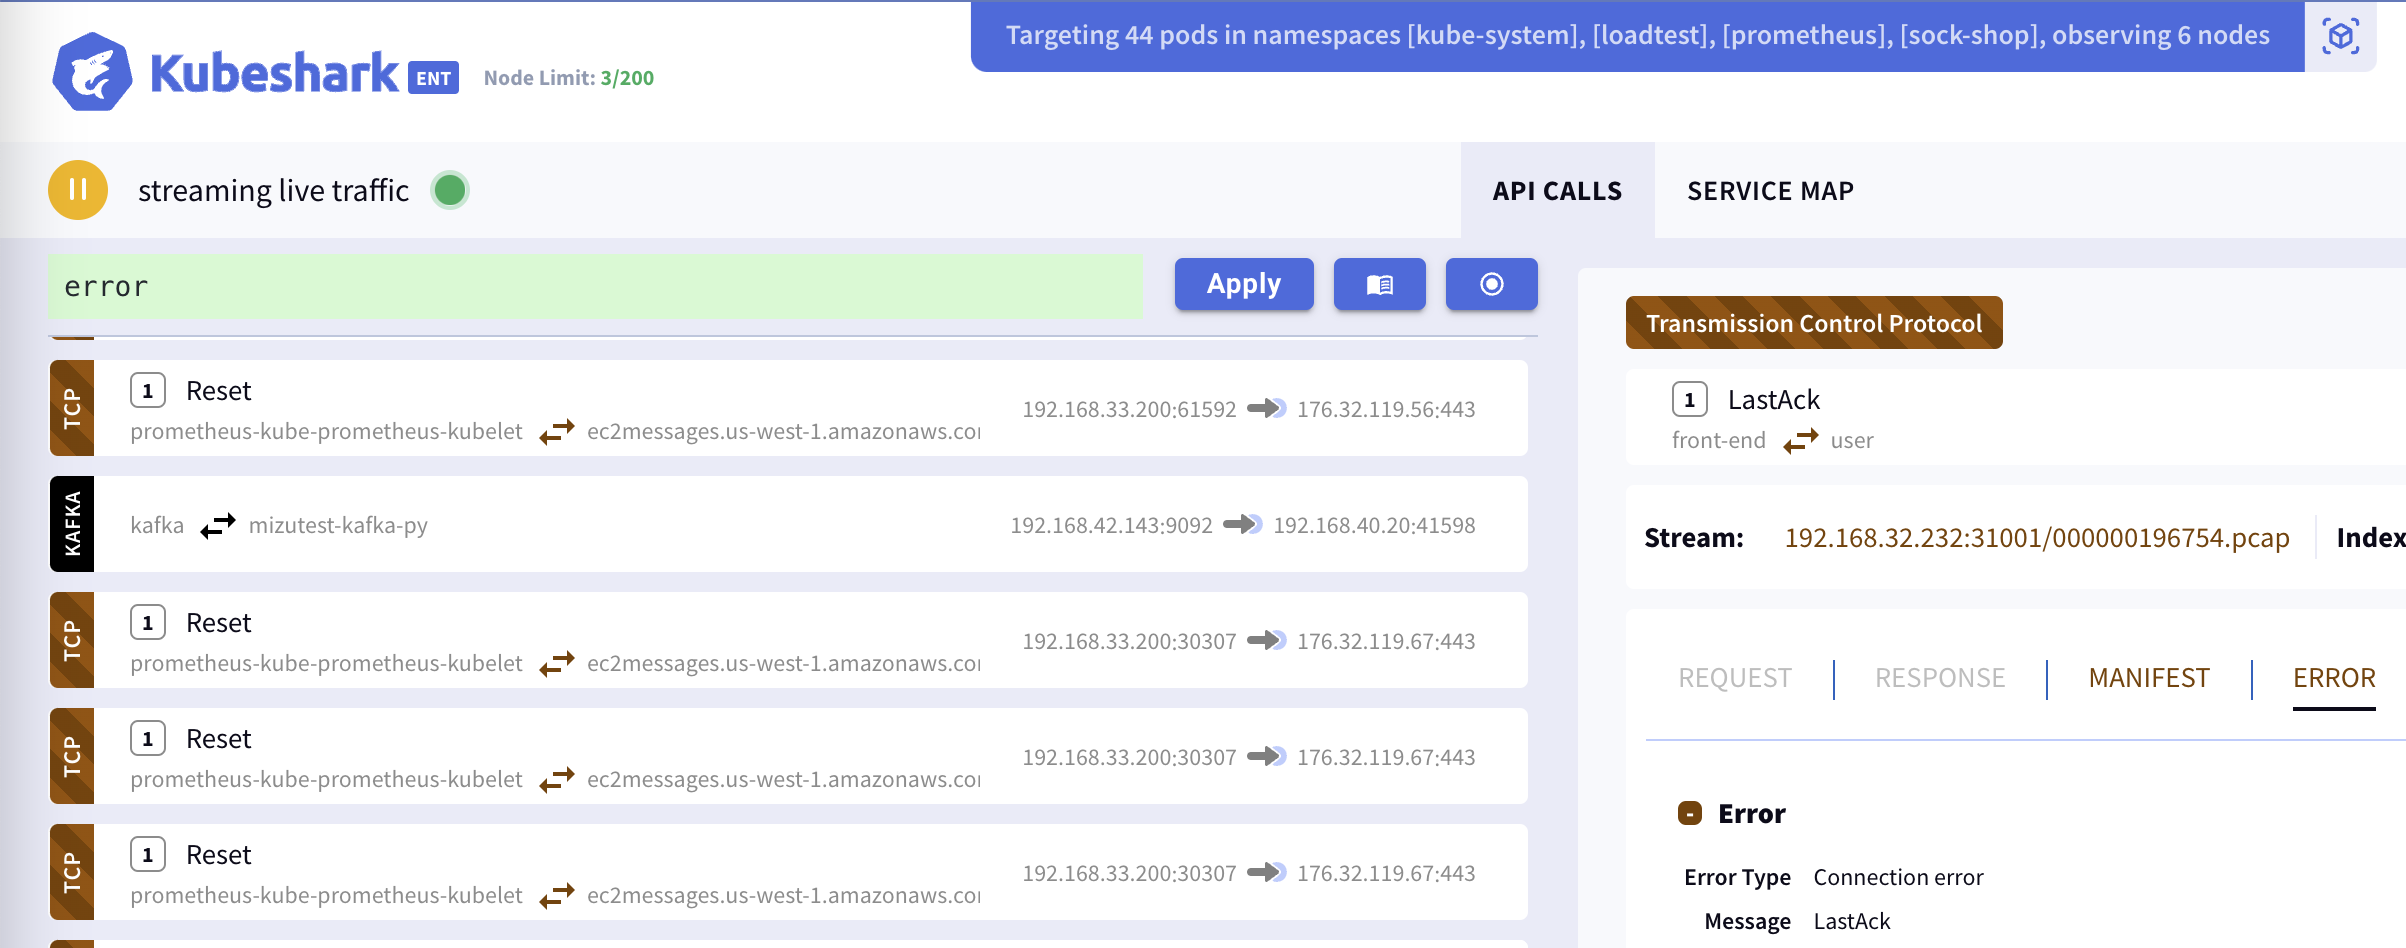
TCP (Connection) Errors
Connection errors, identified as part of the TCP protocol, include:
| Error | Description |
|---|---|
| SynSent | The client attempted to establish a connection, but the connection was refused. SYN sent, but ACK not received. |
| CloseWait | One side closed the connection with FIN, but the final ACK confirmation is pending. |
| LastAck | One side received a FIN from the peer, sent an ACK, sent a FIN, and is waiting for the final ACK from the peer. |
| Reset | A RST packet is seen, indicating that one side will neither accept nor send more data. |
Timeout Errors
Kubeshark’s L4 stream capture times out after 10 seconds. If an L4 stream capture doesn’t complete within this timeframe, the stream is marked stale and dropped. THe timeout time is configurable and can be set using this configuration value:
tap:
    tcpStreamChannelTimeoutMs: 10000 # in milliseconds
or use: --set tap.tcpStreamChannelTimeoutMs=10000
Packet Loss
Packet loss can cause Kubeshark L4 streams to timeout and parser errors. Additionally, lost packets might result in no symptoms and no signals.
Potential causes of packet loss:
| Cause | Description |
|---|---|
| Insufficient CPU resources for Kubeshark | Packet loss can occur when Kubeshark is unable to read packets quickly enough, often due to a lack of CPU resources. |
| AF-PACKET vs PF-RING | AF-PACKET is prone to packet loss, whereas PF-RING is less likely to cause it. |
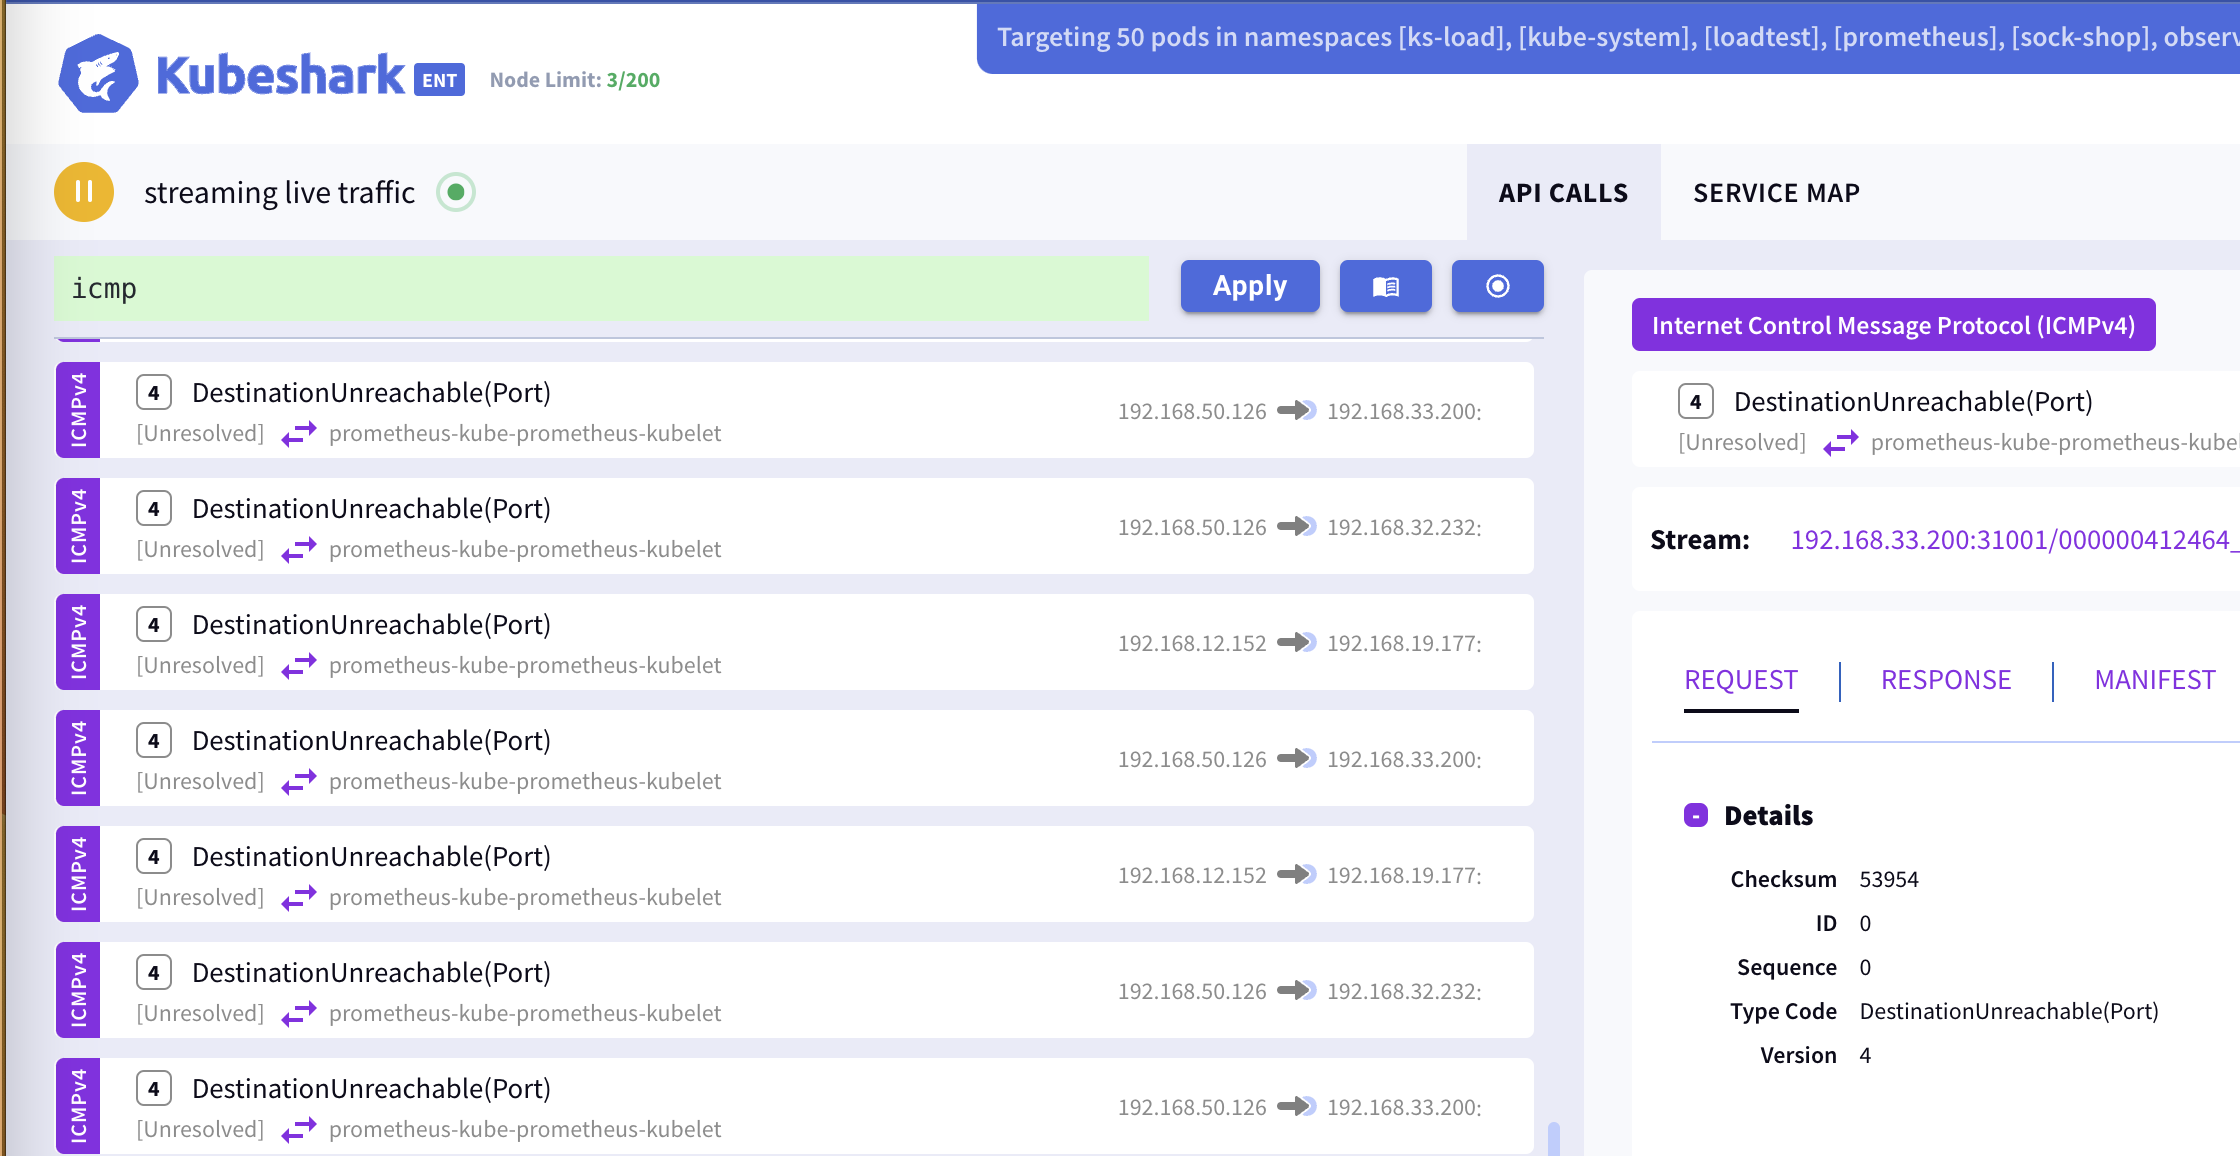
ICMP
Kubeshark intercepts, dissects, and presents ICMP messages. ICMP is an L4 protocol used for error reporting and network diagnostics. For instance, if a router cannot forward a packet because the destination is unreachable, an ICMP message is sent back to the sender indicating the problem.
Partial list of errors reported by ICMP messages:
Destination Unreachable: Sent when a packet cannot be delivered to its destination for various reasons, with subcodes including:
- Network Unreachable
- Host Unreachable
- Protocol Unreachable
- Port Unreachable
- Fragmentation Needed and DF (Don’t Fragment) set
- Source Route Failed
- Destination Network Unknown
- Destination Host Unknown
- Source Host Isolated
- Network Administratively Prohibited
- Host Administratively Prohibited
- Network Unreachable for Type of Service
- Host Unreachable for Type of Service
Time Exceeded: Indicates that the Time to Live (TTL) field of the packet has reached zero, necessitating discarding the packet. This is commonly used in network route tracing.
Source Quench: A deprecated message requesting the sender to decrease the message sending rate due to router or host congestion.
Redirect Message: Sent by routers to indicate a more efficient packet routing path.
Parameter Problem: Indicates an error in the IP packet header fields, preventing processing.
Router Advertisement and Router Solicitation: Used for routing information discovery and announcement.
Dissection Errors
Dissection errors are reported by Kubeshark protocol parsers:
| Error | Description |
|---|---|
| unexpected EOF | TCP connection closed unexpectedly. |
| Parser error | Kubeshark’s application layer protocol parser reports an invalid payload according to the protocol definition. |
L4 Stream Capture Timeout
Kubeshark will drop entire Layer 4 (L4) streams if not all packets are captured before the process times out.
The default timeout is set to 10 seconds. This can be modified by setting the tap.tcpStreamChannelTimeoutMs parameter.
Half Connections
Half connections represent incomplete transactions where either a request or a response is missing.
Kubeshark aims to identify the reasons for these incomplete transactions.
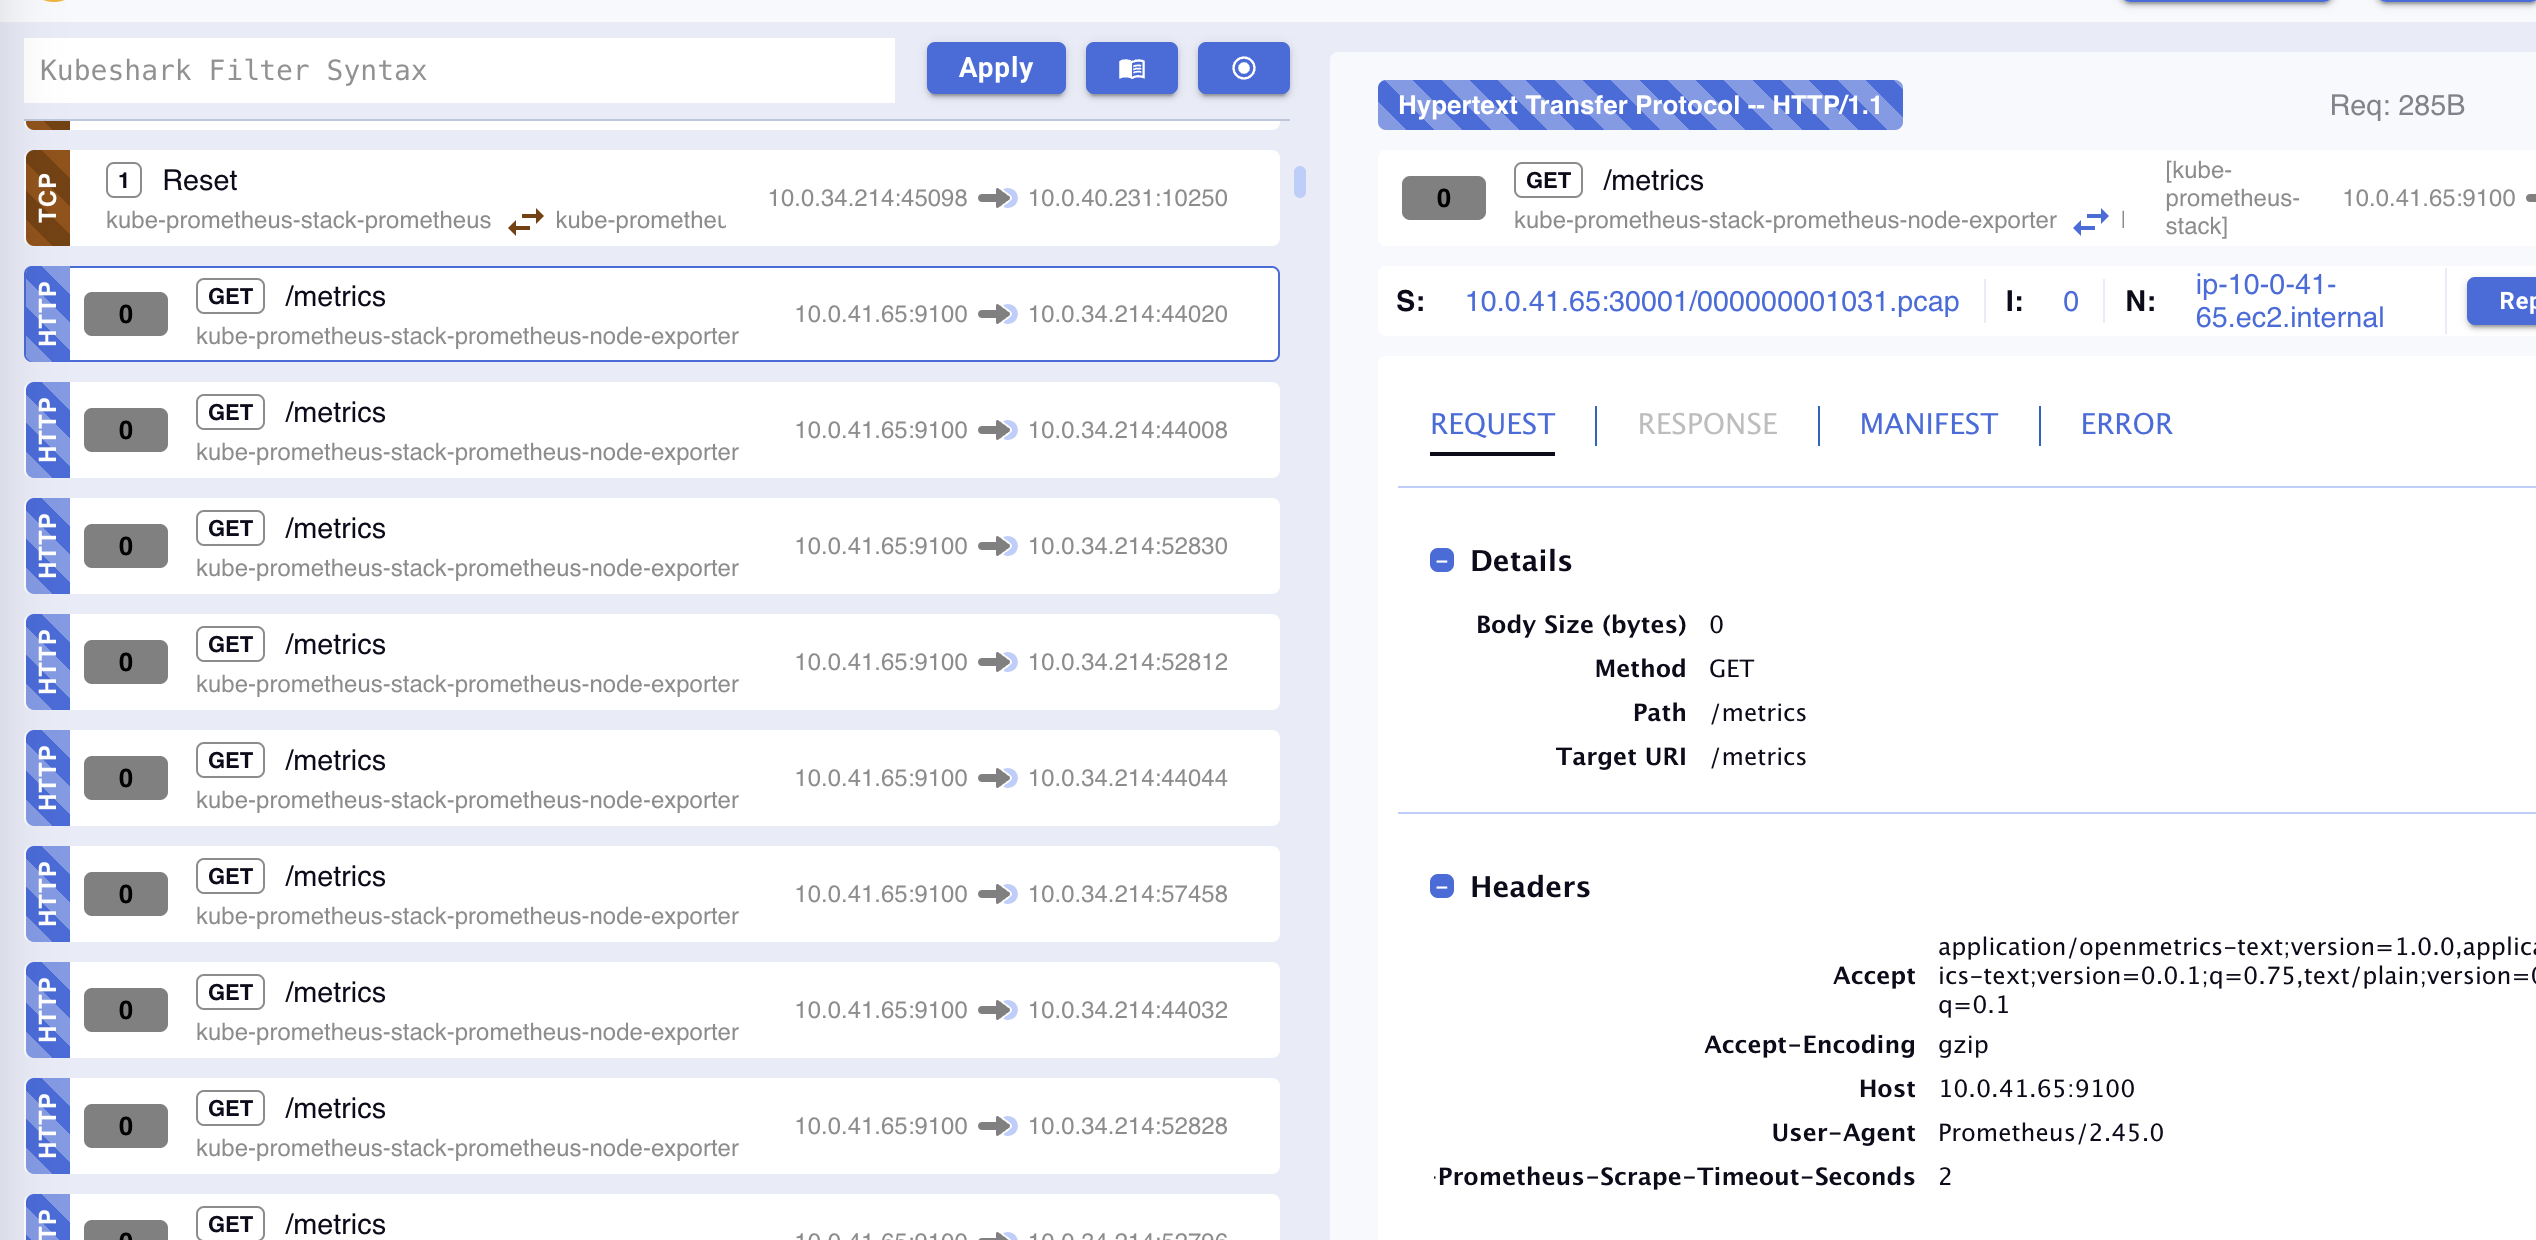
Error Filter
Use Kubeshark Filter Language (KFL) to selectively display or filter out various errors. For example:
!error      # Filters out any half-connections
!icmp       # Filters out any ICMP entries
!tcp        # Filters out any TCP level errors
Tip: Error Dashboard
Enter the following KFL in the KFL box:
response.status > 400 or error or icmp or tcp, apply, copy and enter to favorite.
The link should look like this:
http://<kubeshark-domain>:<port>/?q=response.status%20%3E%20400%20or%20error%20or%20icmp%20or%20tcpIt will look even better on a 60” screen.