PCAPs, L4 Streams and API metadata
Optimized for Performance and Scale
Kubeshark captures all L4 (UDP and TCP) streams and stores each L4 stream in a separate PCAP file in the root file system of each node in the cluster.
In addition following successful dissection, all of the API information (e.g. headers, path payload) is stored in a dedicated JSON file for each request/response pair.
PCAP - Network Traces
PCAP, short for packet capture, is an API and a file format that is commonly used by network analysis tools such as Wireshark, Fiddler and TCPdump.
PCAP provides all packet information from the Ethernet header all the way to the application payload, providing you with the full visibility of the application and network interaction, pre- and post-event.
PCAP file format is suitable to contains network traces that include all communication information relevant to the trace.
API metadata
Complete API metadata including every element that is visible in the Dashboard and more is stored in JSON file.
Here’s some of the information available in the API metadata JSON file. The file is available to view or download by pressing the API index link:
!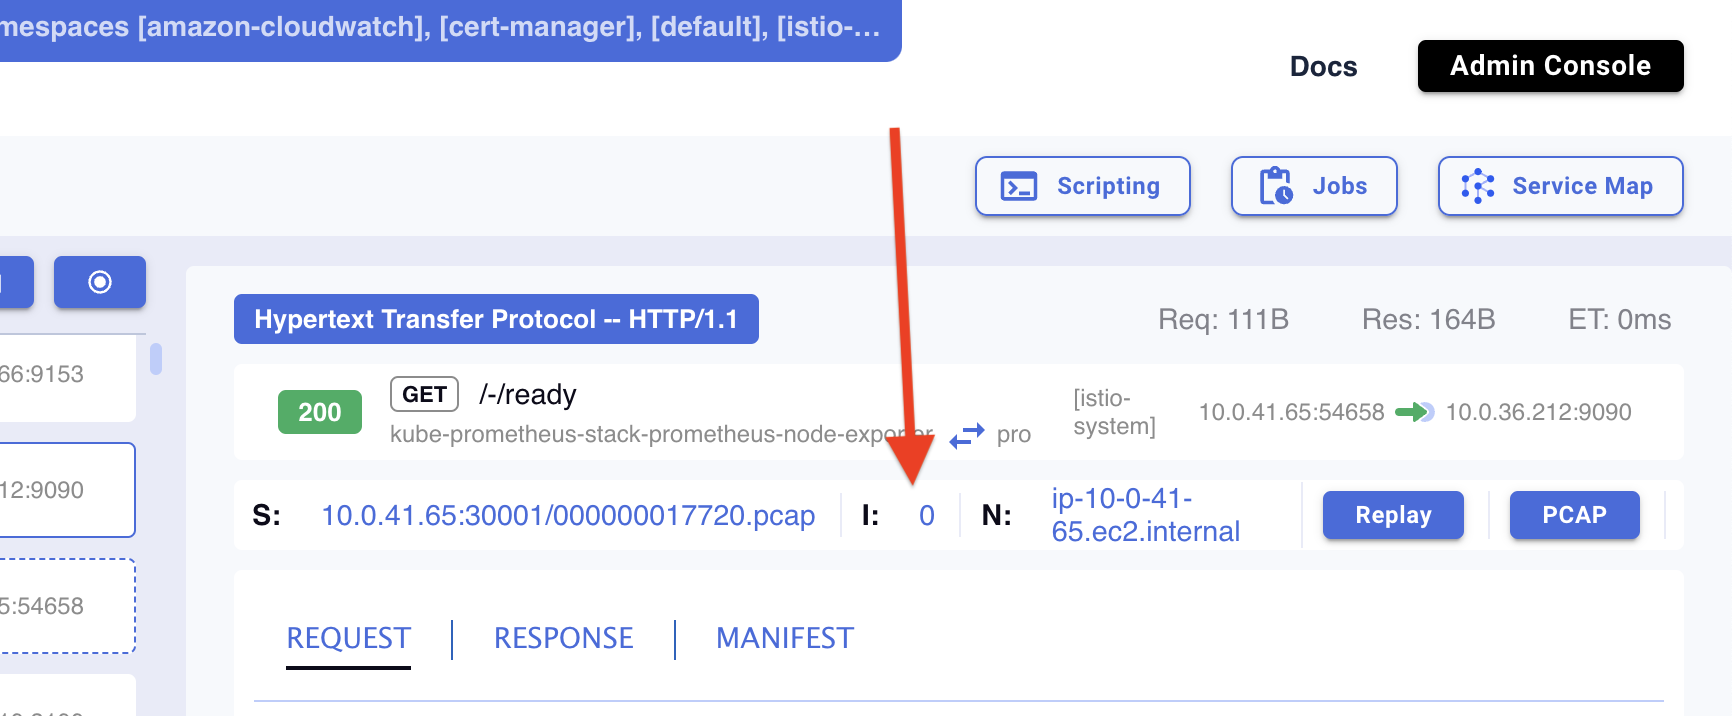
{
    "dst": {..},
    "elapsedTime": 0,
    "entryFile": "000000017720_pcap-0_entry.json",
    "error": null,
    "failed": false,
    "id": "10.0.41.65:30001/000000017720.pcap-0",
    "index": 0,
    "node": {..},
    "outgoing": false,
    "passed": false,
    "protocol": {..},
    "record": "",
    "request": {..},
    "requestSize": 111,
    "response": {..},
    "responseSize": 164,
    "src": {..},
    "startTime": "2023-12-19T20:44:30.360984398Z",
    "stream": "000000017720.pcap",
    "timestamp": 1703018670360,
    "tls": false,
    "worker": "10.0.41.65:30001"
}
Short-term Vs Long-term Data Retention
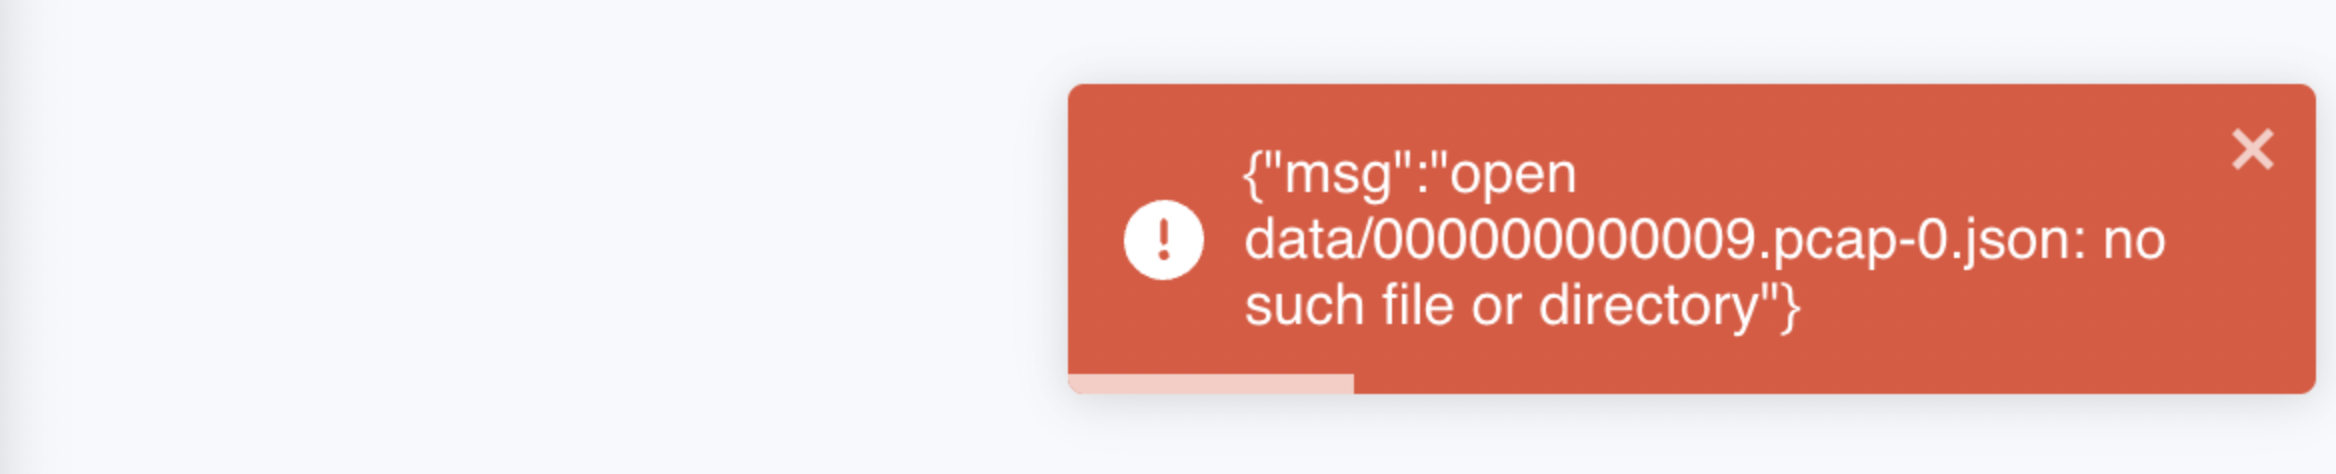
Kubeshark provides real-time visibility into API traffic, enabling its users to view full API traffic details within a short-term retention window. This window is determined by the throughput and the storage allocated for it, all at the K8s node level. Once outside of this window, details are no longer available to view and attempting to do so will result in an error.
For information on long-term traffic retention, read the Traffic Recorder section.
Guardrails
Because storage can fill up rapidly, we have established certain guardrails to prevent overuse of disk resources.
PCAP and JSON TTLs
PCAPs have a TTL of 10s and JSONs have TTL of 5 minutes. That means that the metadata is available for viewing up to 5 minutes from the point of capture and PCAPs stay on disk only for 10 seconds, enough for a script to handle the PCAP file, before being deleted.
Storage Limit
The storage limitation is regulated by the tap.storagelimit configuration value, with the default set to 500Mi. This value represents a hard limit. If storage surpasses this limit, it will result in pod eviction. When the Worker pod is evicted, the storage is purged and the pod immediately restarts from scratch.
To increase this limit, simply provide a different value (e.g., setting it to 1GB with --set tap.storagelimit=1Gi).
When an L4 stream is dissected, a JSON file is generated with all relevant details. This file has a time to live of 5 minutes.
The actual L4 stream (PCAP) has a time to live of 10 seconds, enough for a script to copy it to a different folder if retention is required.