Pod-to-pod Connection Analysis
This functionality is particularly useful for answering the following questions:
- Which pod is attempting to connect to a specific external IP or service?
- Why is a certain pod-to-service connection failing?
- Why am I not seeing certain traffic?
Enabling and Filtering
To analyze pod-to-pod connections, follow these steps:
- Ensure the TCP dissector is enabled by following the instructions in the protocols section.
- Enter the
tcpKFL alias in the display filter box.
The above instructions will cause Kubeshark to analyze and show only TCP packets.
Pod-to-pod connection analysis enables you to detect every connection between pods and external services. It displays all connections and allows the user to search for specific ones. Regardless of the protocol or encryption, as long as it runs over TCP, it will appear in the Kubeshark Dashboard.
For example, the following image illustrates a namespace connectivity map, showing the connection between namespaces in the cluster and connections to external services. In this case, two external services, grafana.com and gorest.co.in, are clearly marked with a red rectangle.
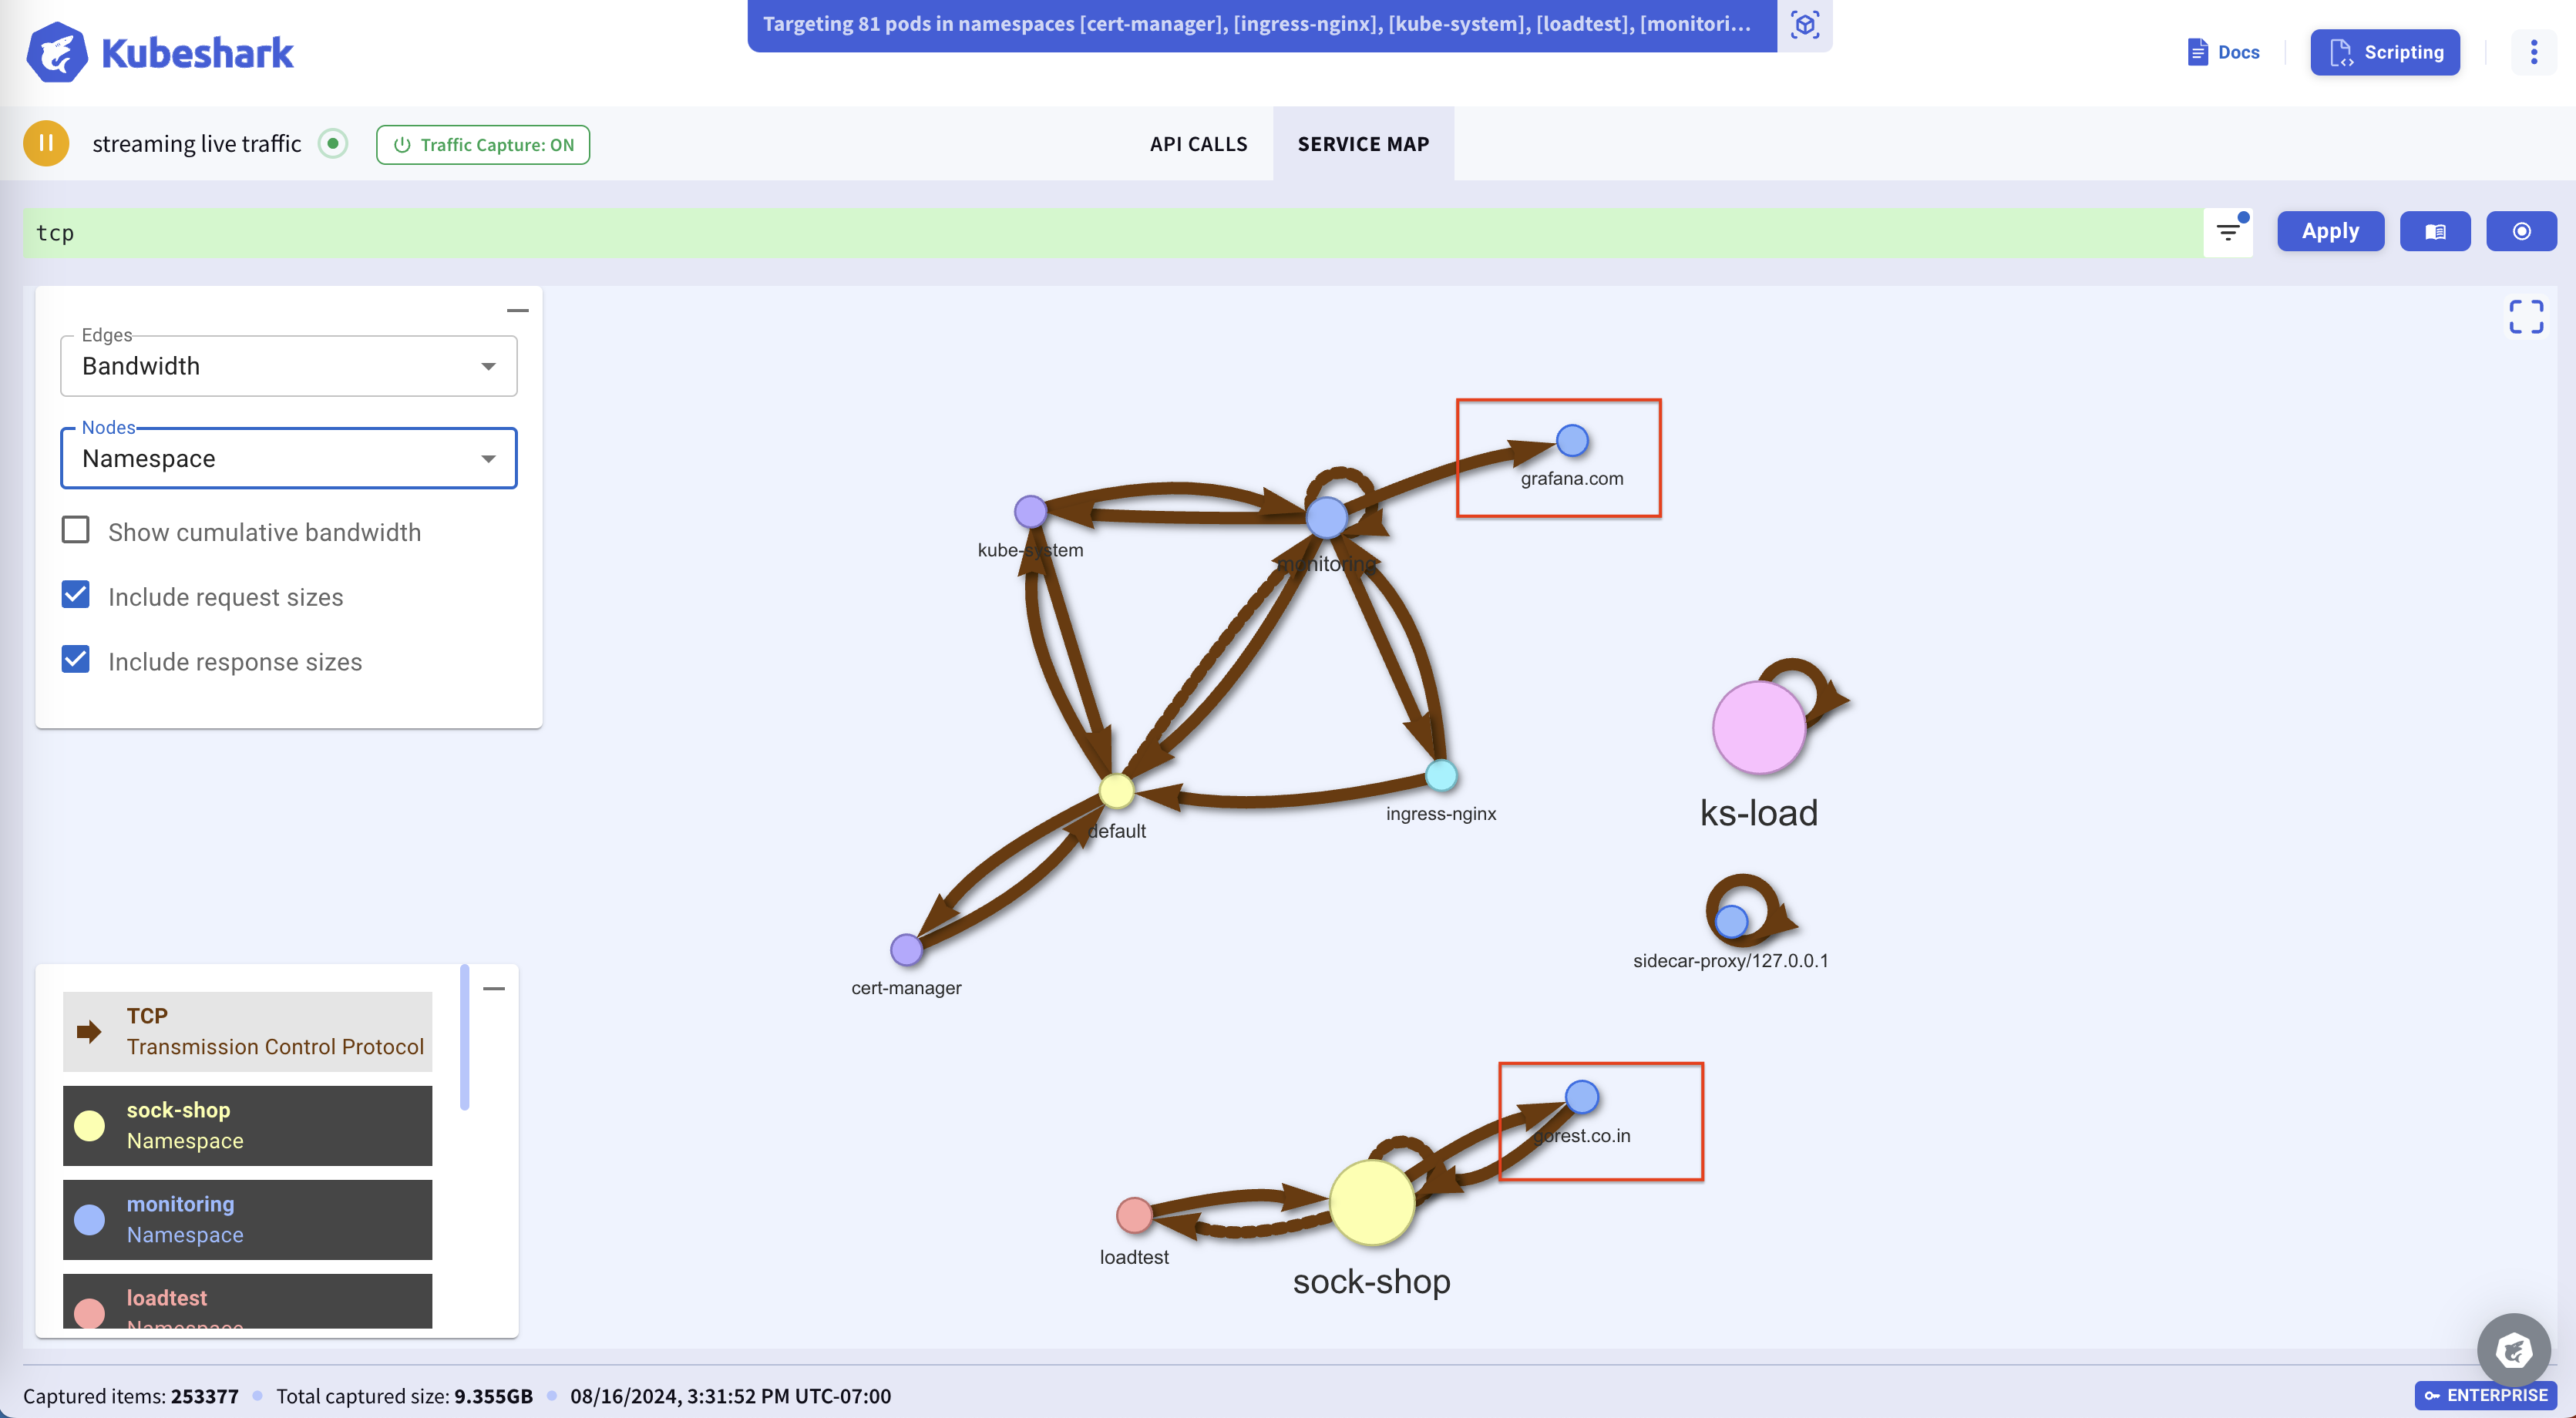
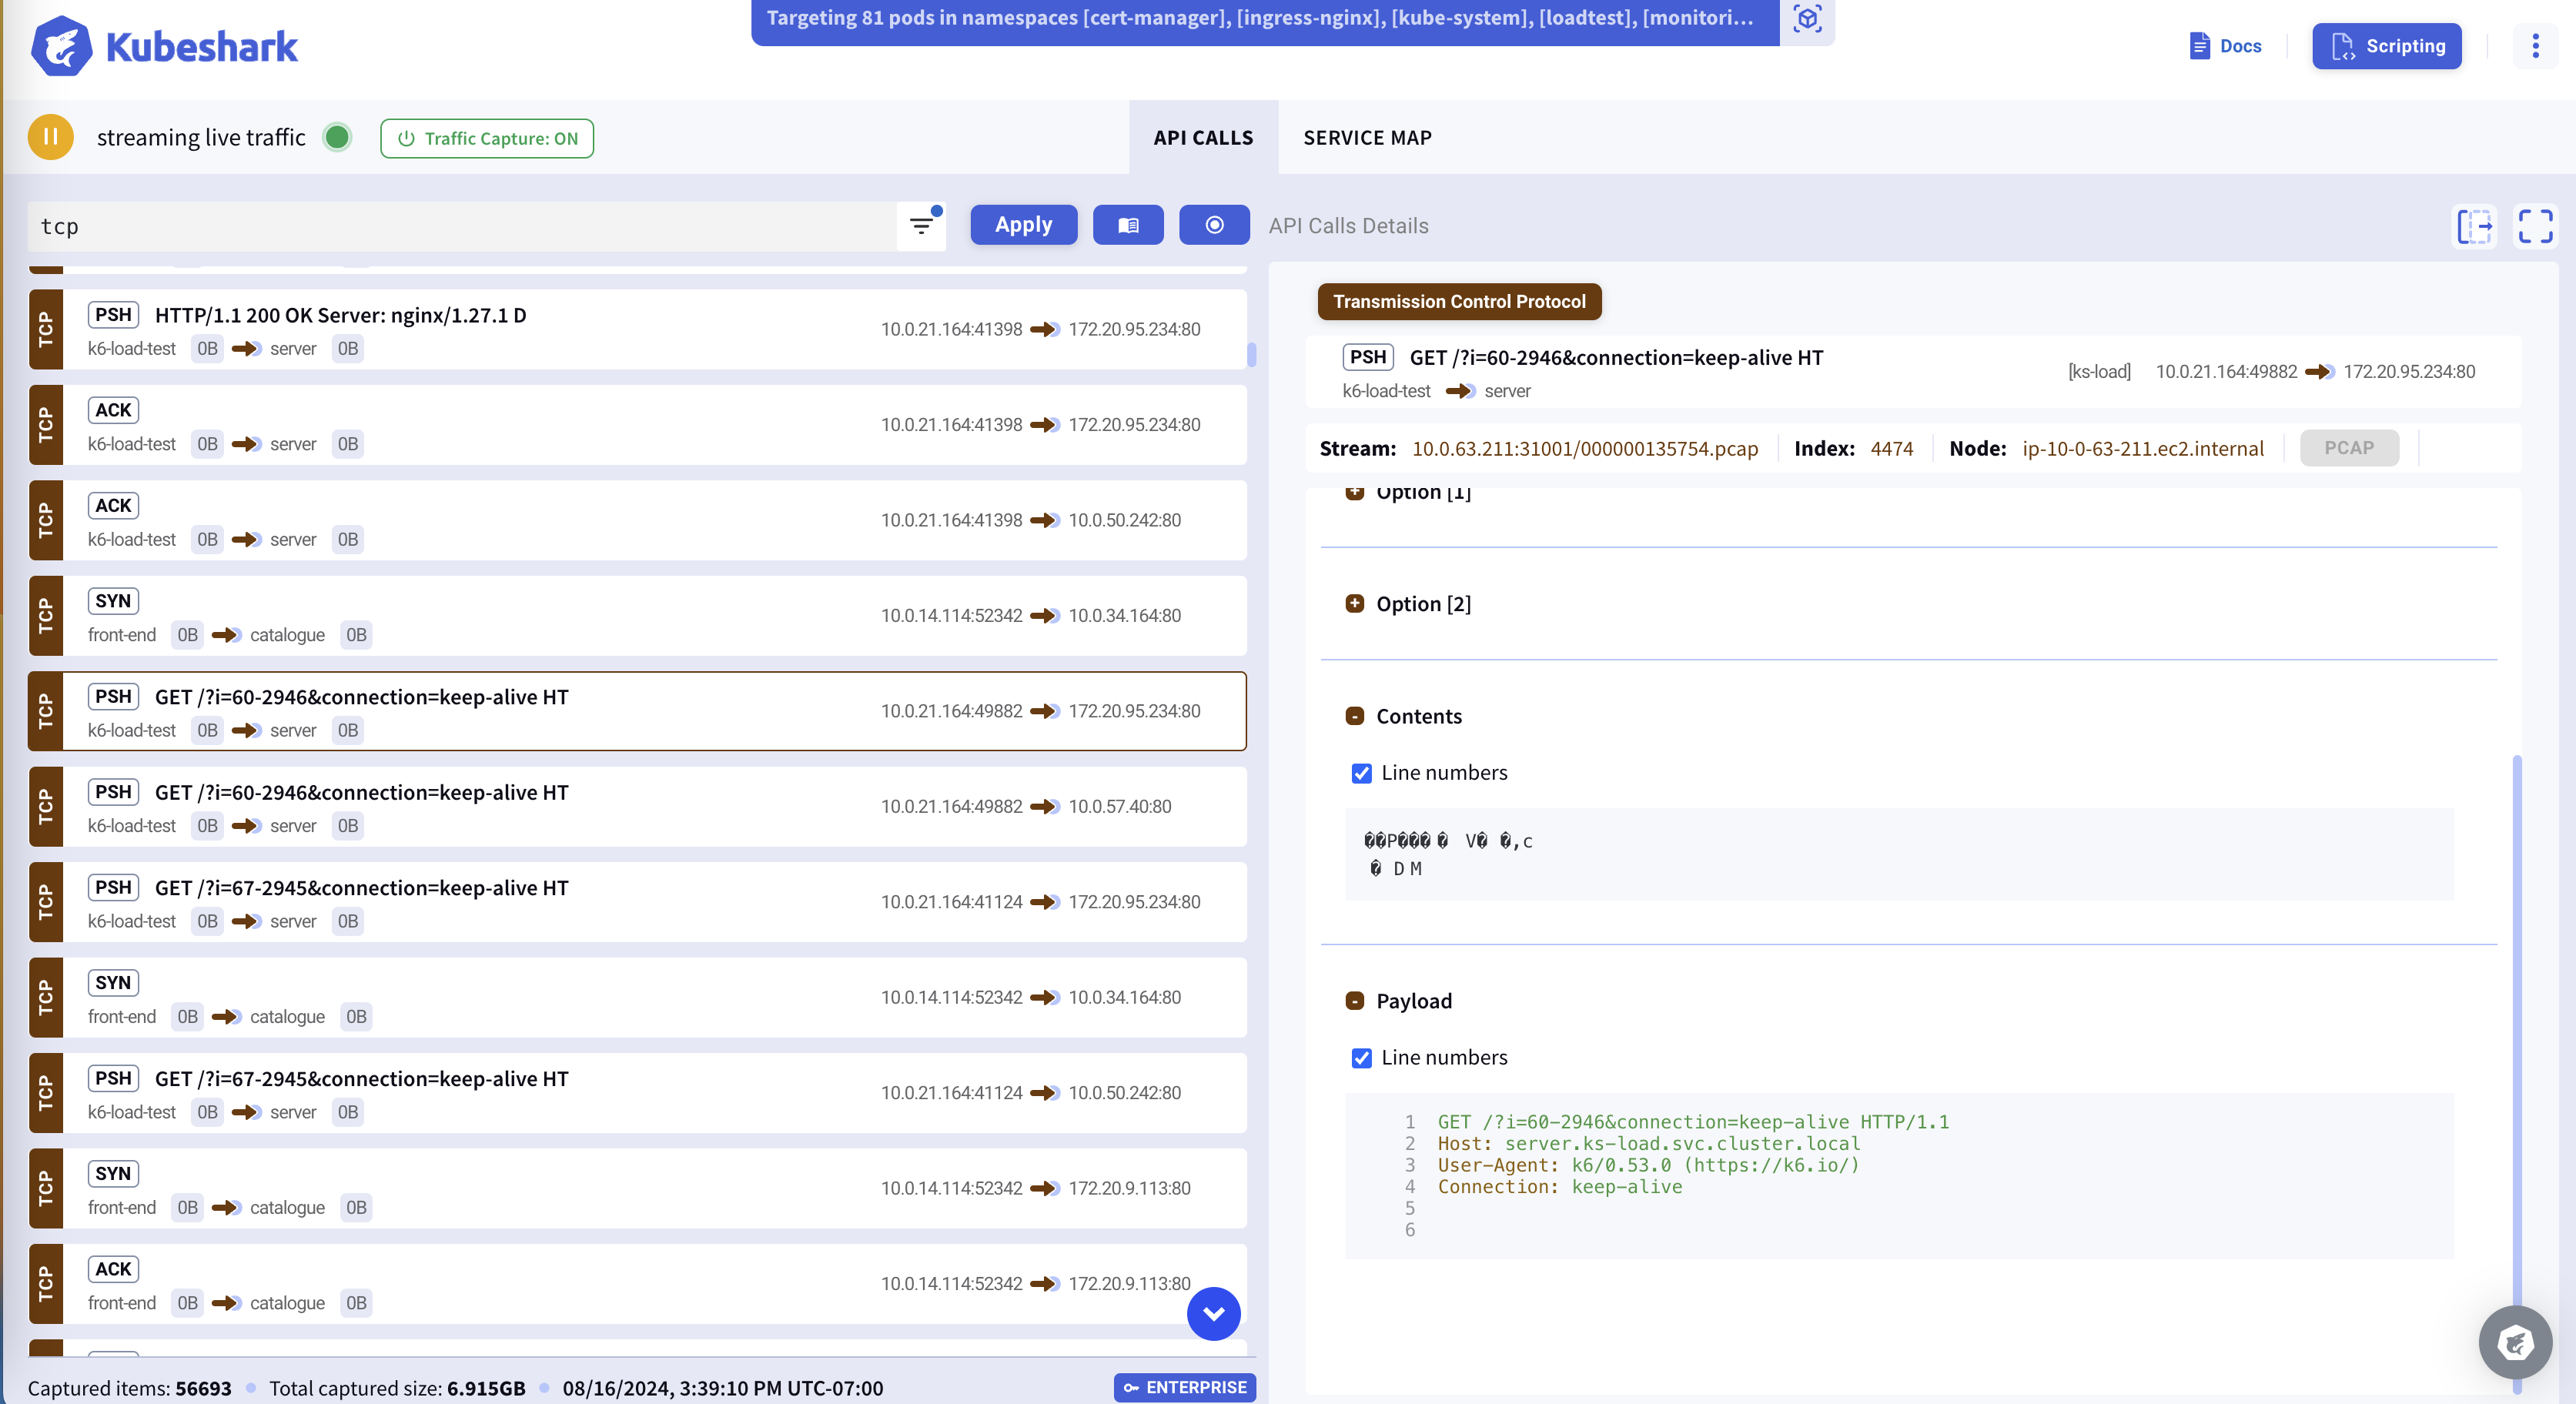
Building a connectivity map and viewing the raw packet content of pod-to-pod communication becomes possible when enabling the tcp dissector, which starts processing all TCP packets. In addition to the connectivity map, you can view and filter all TCP packets.
Performance Impact
Performance impact is expected to improve significantly in the near future.
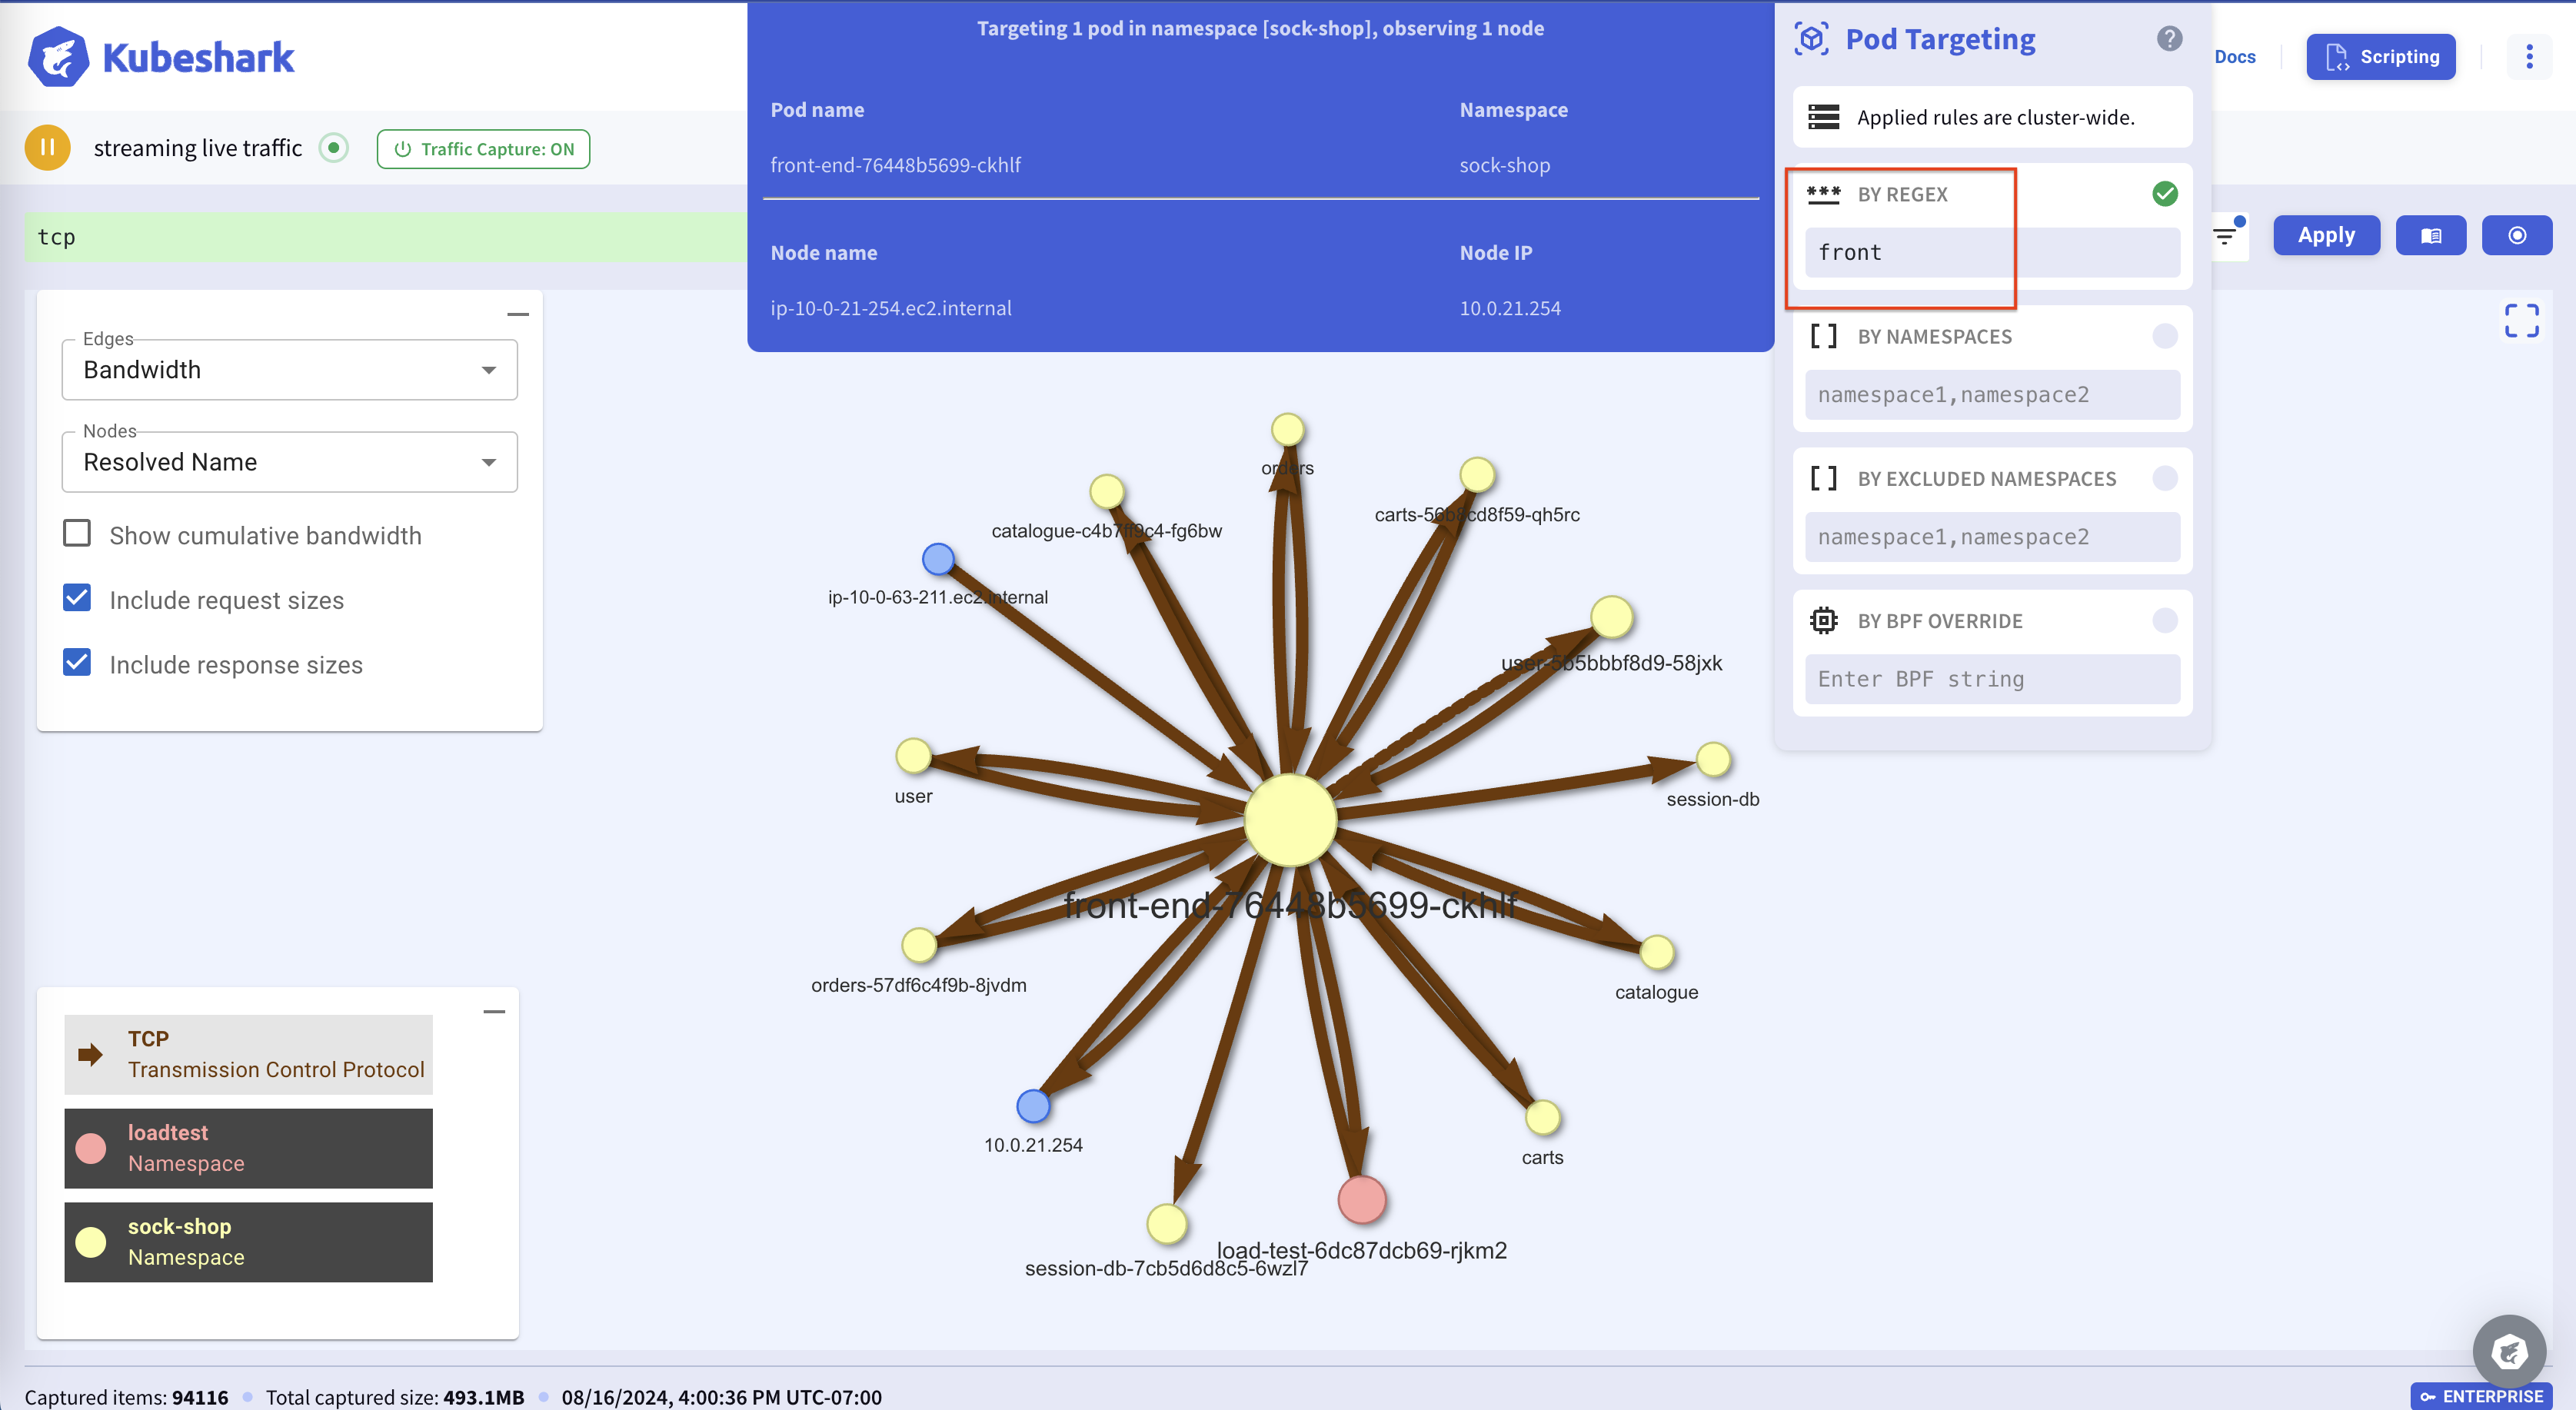
Using this dissector can cause elevated CPU, memory, and storage consumption levels. We currently recommend using this functionality with caution. For example, we do not recommend using this functionality in busy clusters or targeting all pods in the cluster. Instead, we suggest using this functionality in conjunction with pod targeting.
In the following example, we see all the connectivity related to a single pod when setting the proper capture filter:
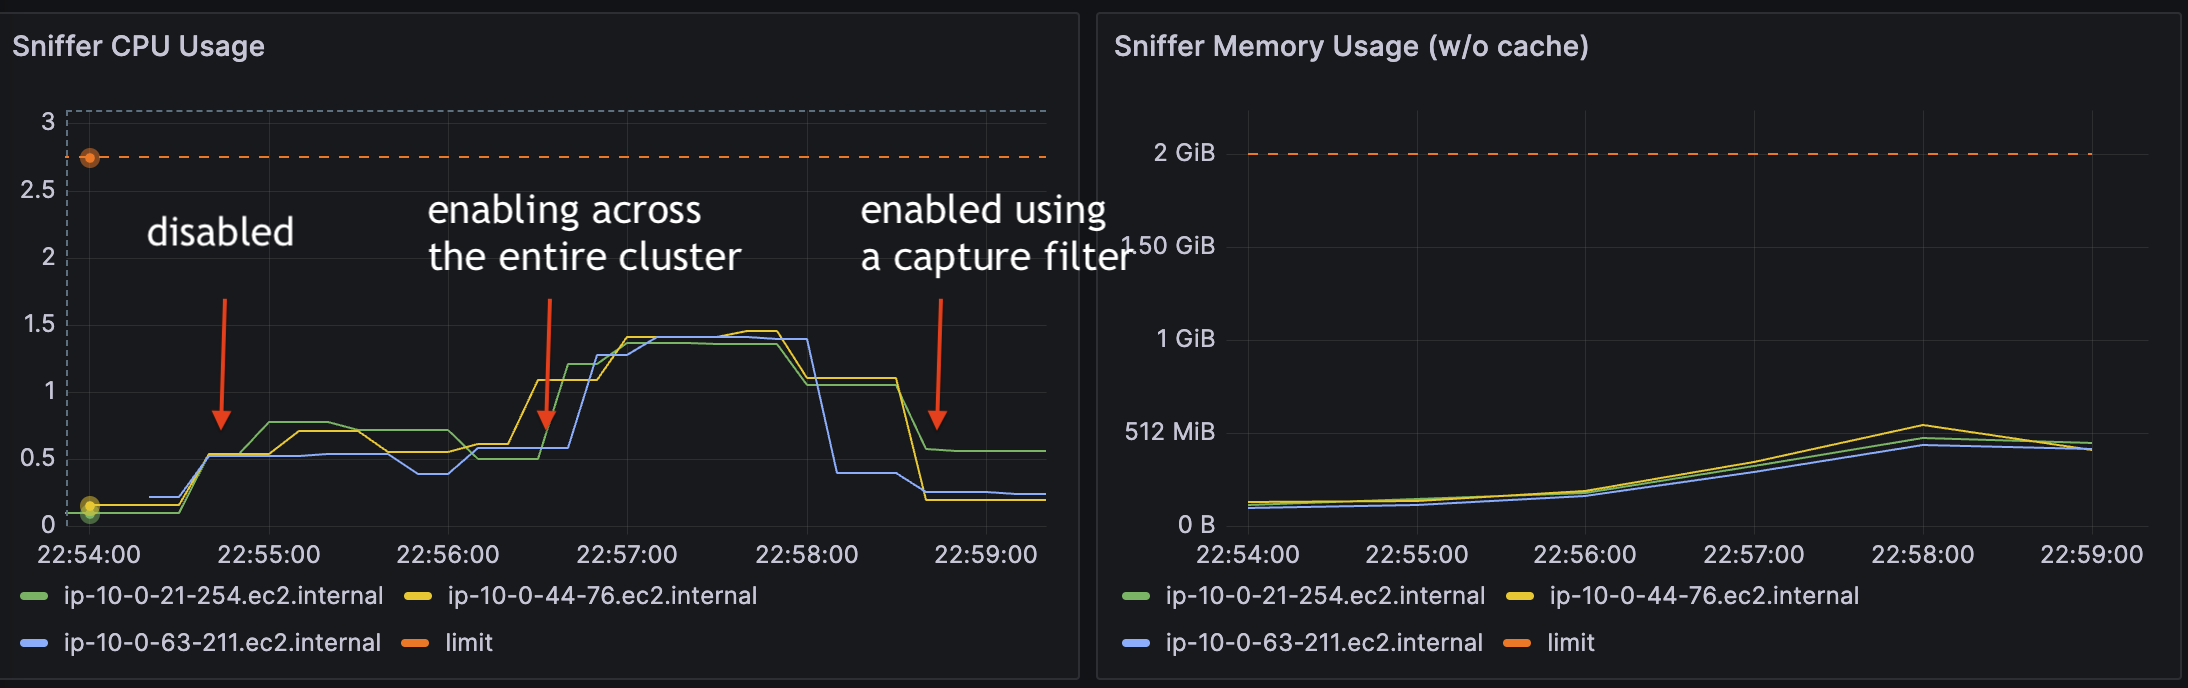
The following image shows that enabling this functionality increases CPU levels. However, using it in conjunction with a capture filter significantly reduces CPU consumption:
Useful Display Filter Queries
- Show all cluster-to-external traffic:
dst.namespace=="" - Show all traffic between two namespaces (e.g., ns1<=>ns2):
(src.namespace=="ns1" and dst.namespace=="ns2") or (src.namespace=="ns2" and dst.namespace=="ns1") - Show traffic going to an external domain:
dst.name=="www.domain.com"
You can experience this functionality in our live demo portal by entering
tcpin the display filter.
What to Expect
Pod-to-pod connection analysis by inspecting all TCP packets is a new feature that we plan to improve in subsequent releases. Our goals include:
- Making it easier to enable/disable this functionality.
- Reducing resource consumption to normal levels, allowing this functionality to work in busy production clusters.
- Adding significant insights derived from such analysis.
- Adding UDP to the analysis.
The
dnsandicmpdissectors can also help in this analysis, usually indicating an intent to make a connection or an issue in the network.