Deep Network Observability
Kubeshark offers real-time, cluster-wide, identity-aware, protocol-level visibility into API traffic, empowering its users to see in their own eyes what’s happening in all (hidden) corners of their K8s clusters. Observe all traffic, including payloads, entering, exiting, and traversing containers, pods, namespaces, nodes, and clusters, with support for REST, GraphQL, gRPC, Redis, Kafka, RabbitMQ (AMQP), DNS, TLS, mTLS, ICMP and TCP (to diagnose TCP errors).
Whether you are resolving issues with your infrastructure, analyzing potential threats, or delving into a security incident, Kubeshark can be highly valuable in pinpointing the responsible factors.
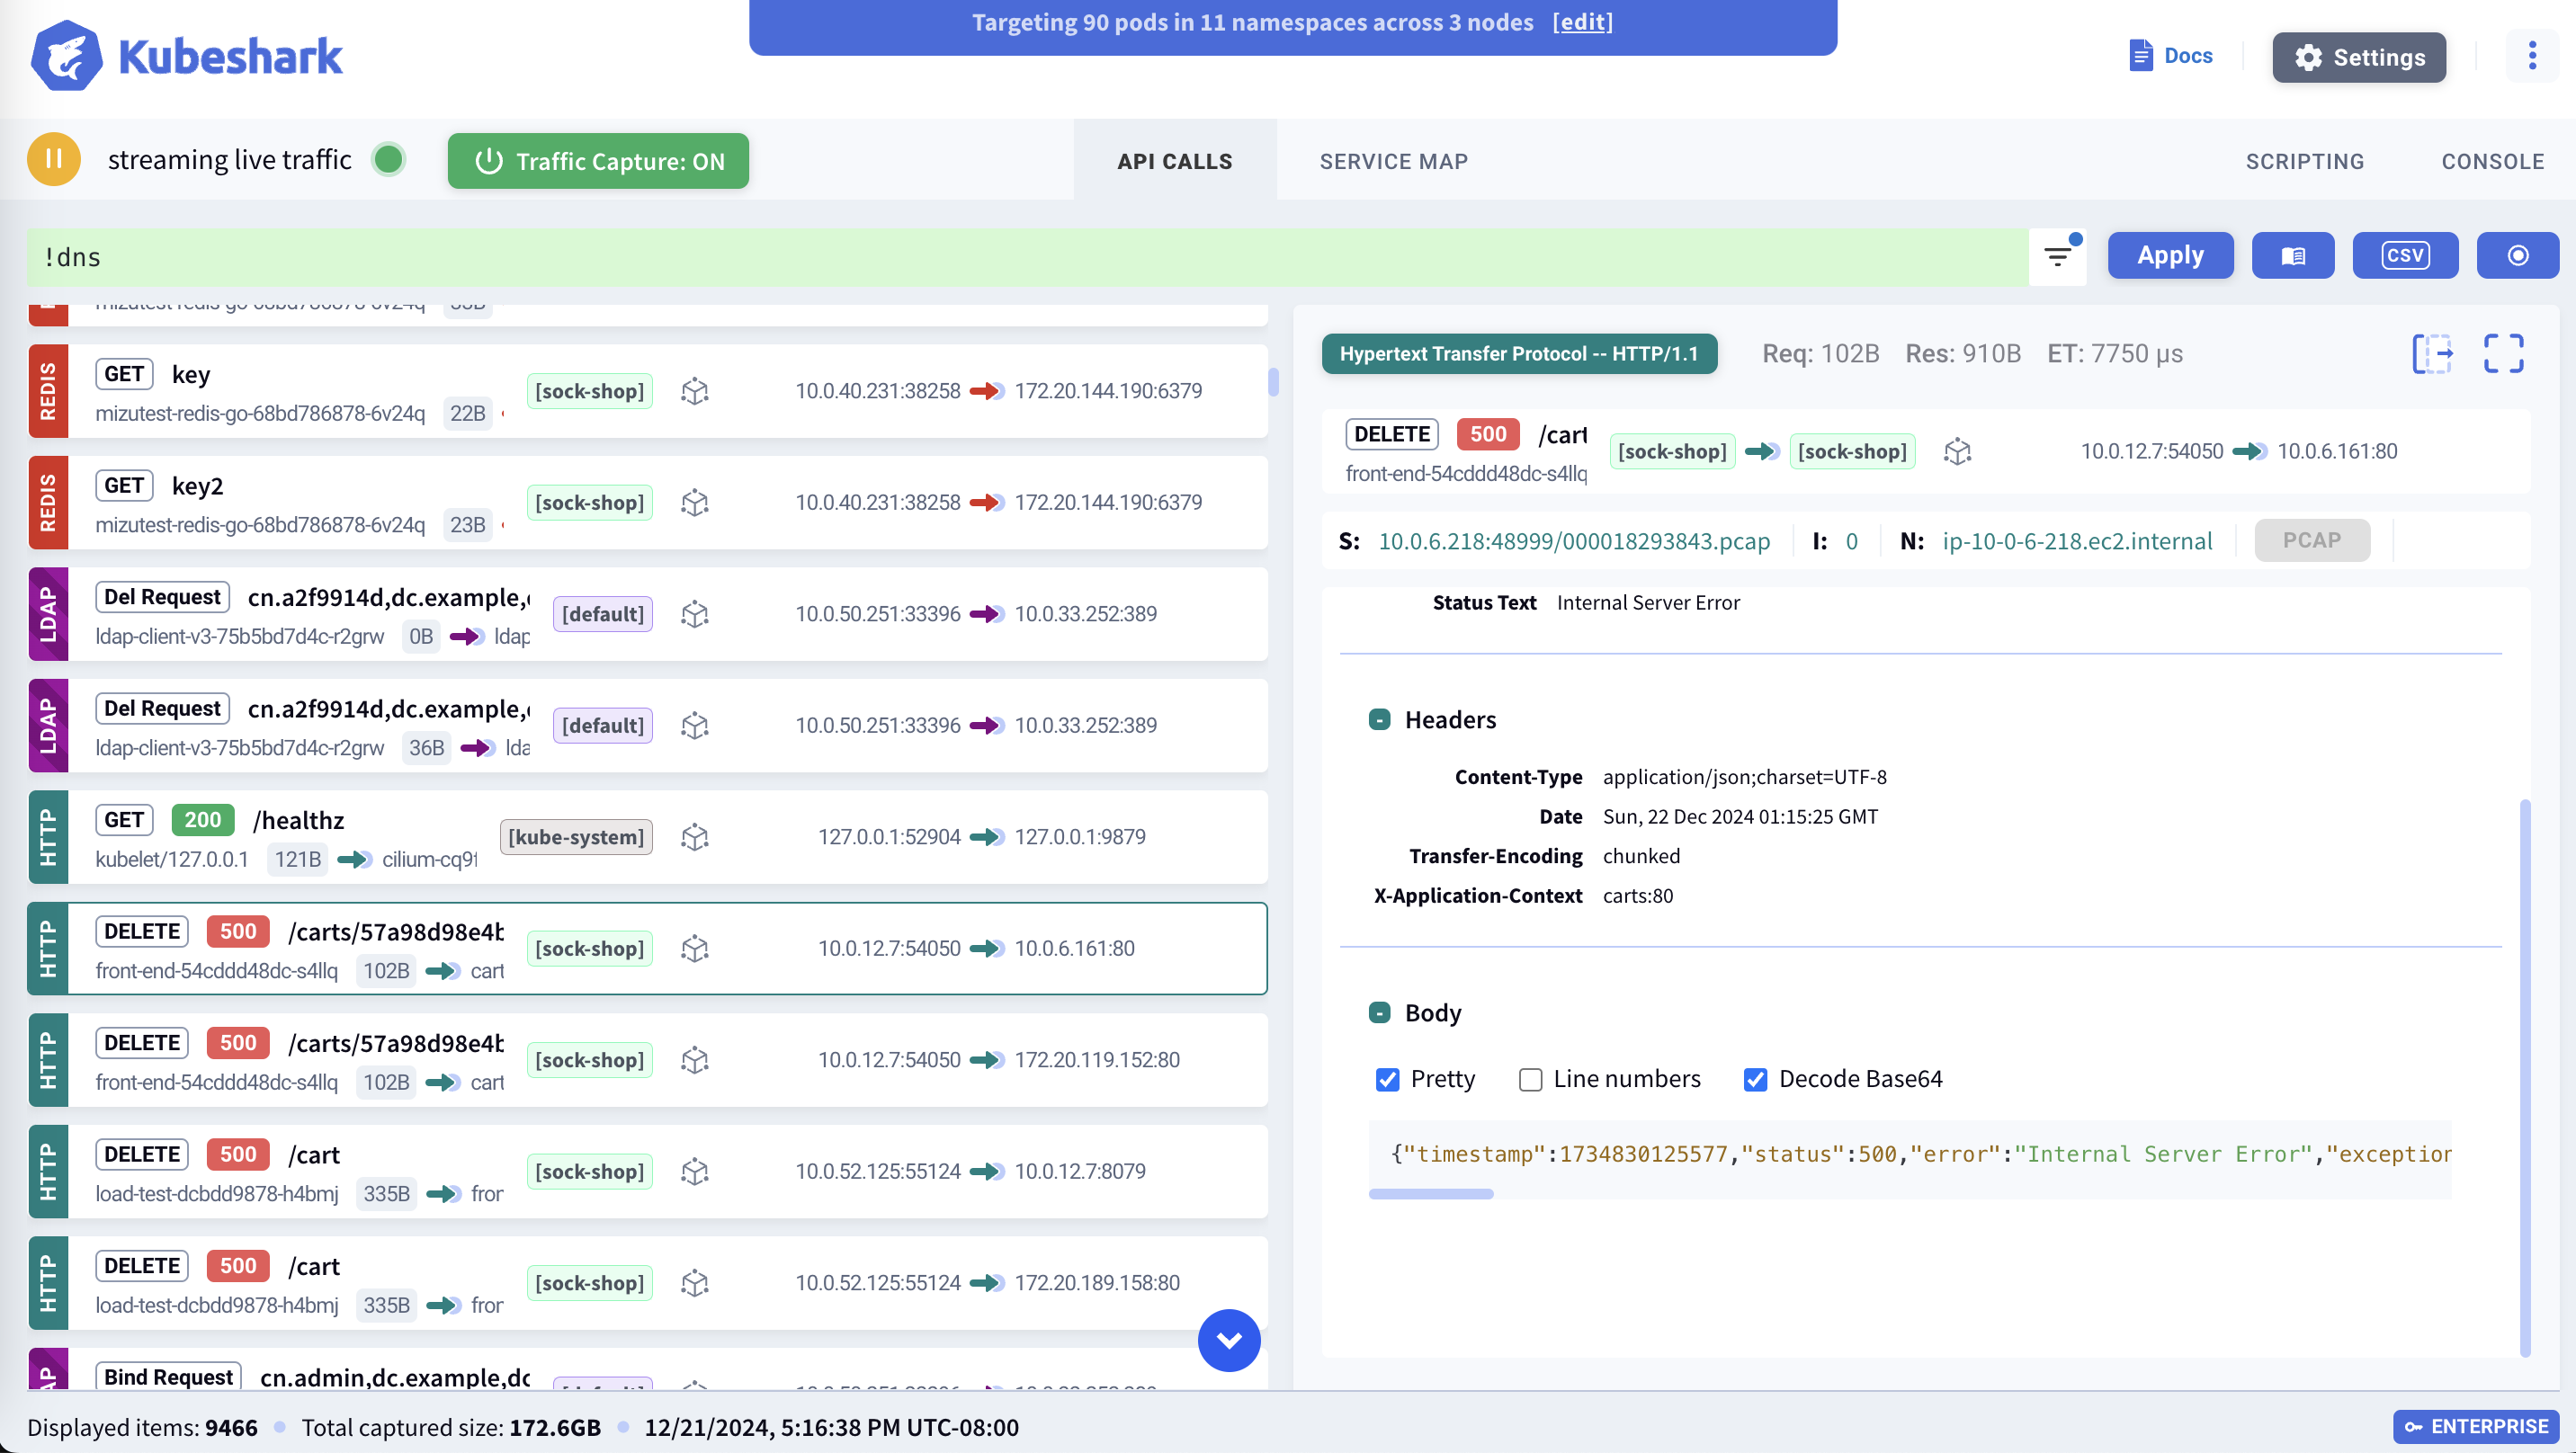
Protocol-level Visibility
Kubeshark captures, dissects and monitors all traffic and payloads going in, out and across containers, pods, nodes and clusters. You can view the dissected protocol messages in the dashboard all the way to the payload level.
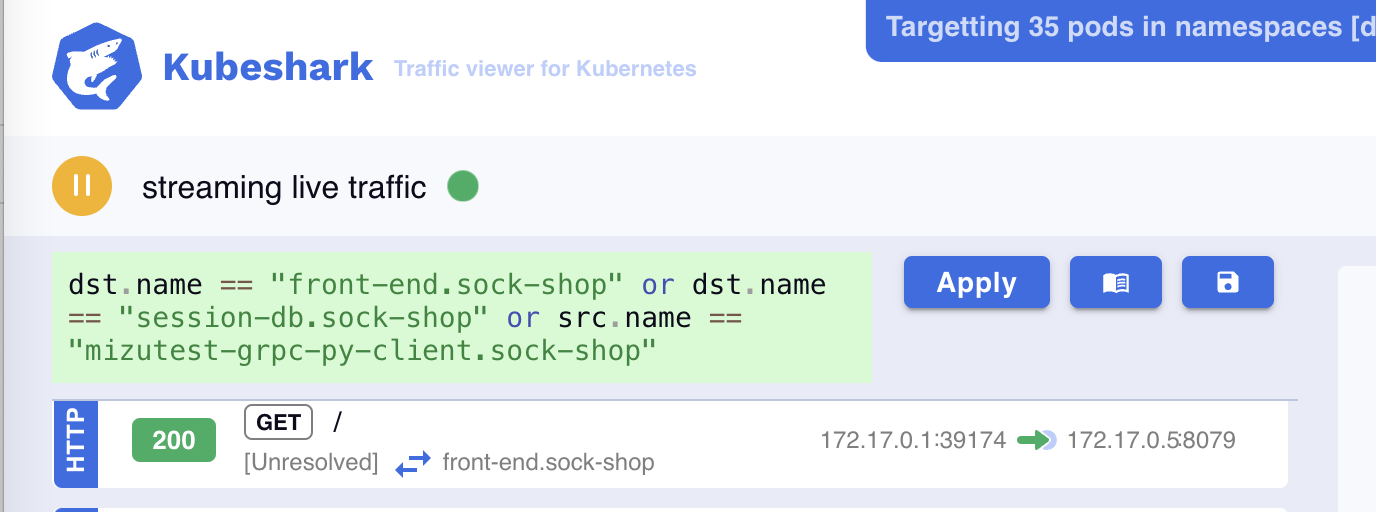
Kubeshark Filter Language (KFL)
As K8s network is massive, filtering enables you to find the `needle in the haystack`.
Here are a few examples:
Filtering traffic that uses a specific token (or tokens in general)
request.headers["Authorization"] == r"Token.*"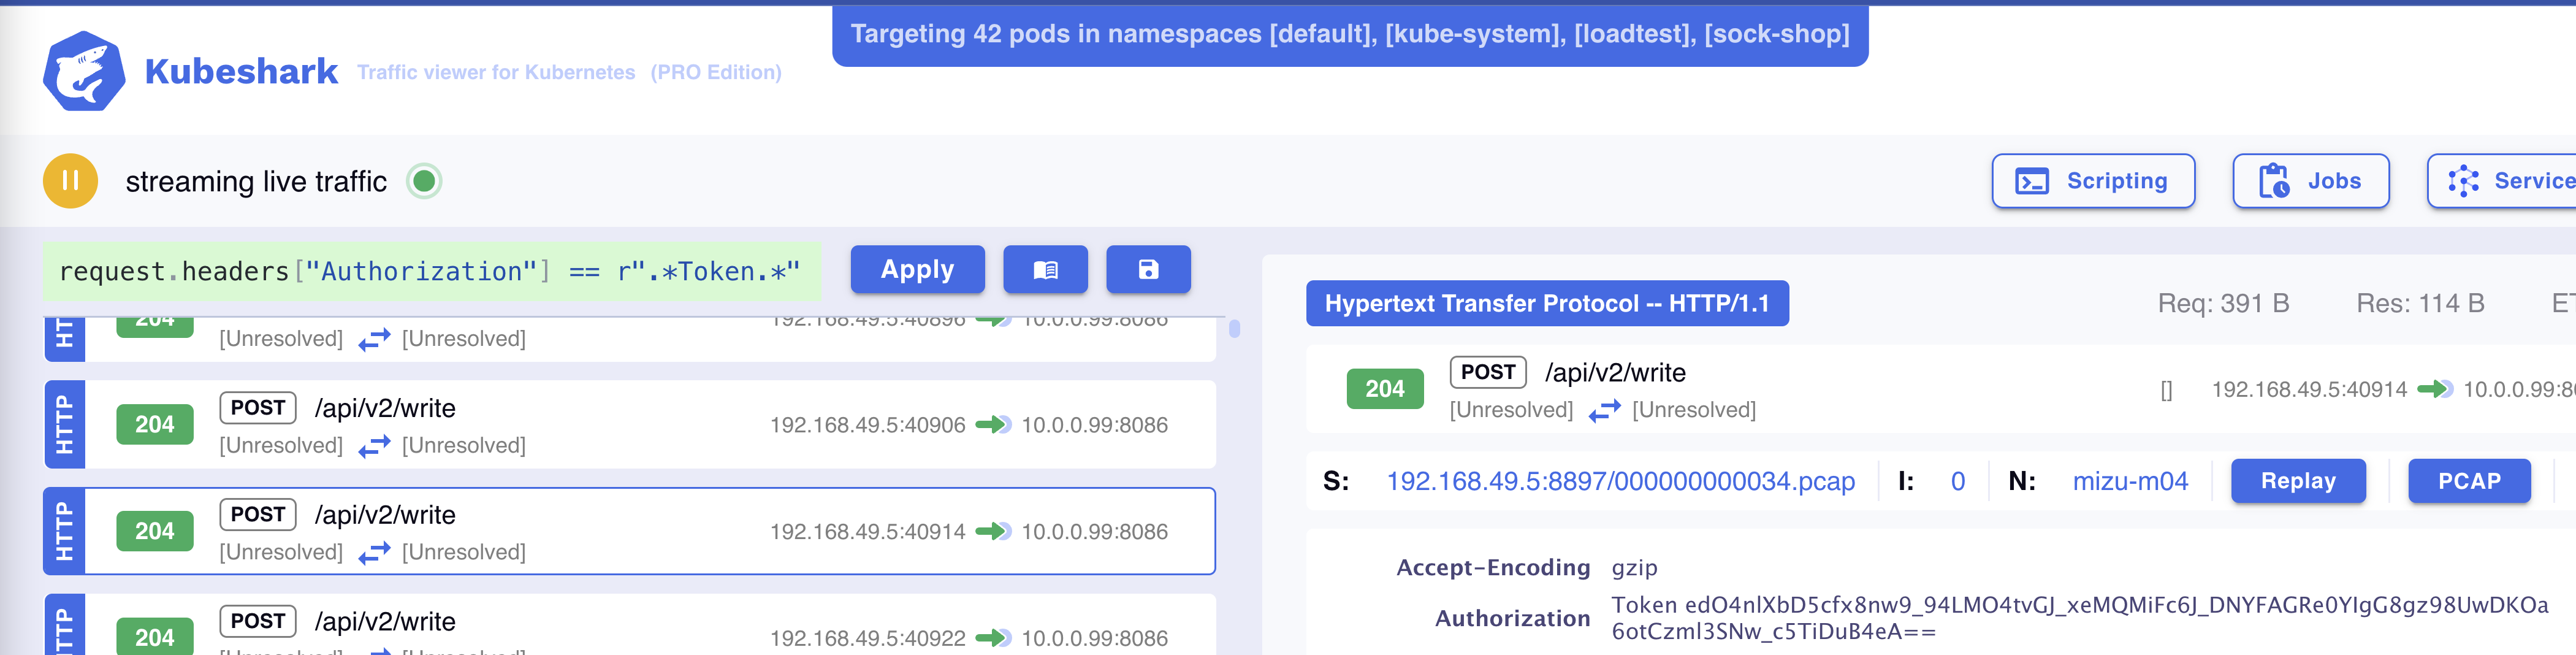
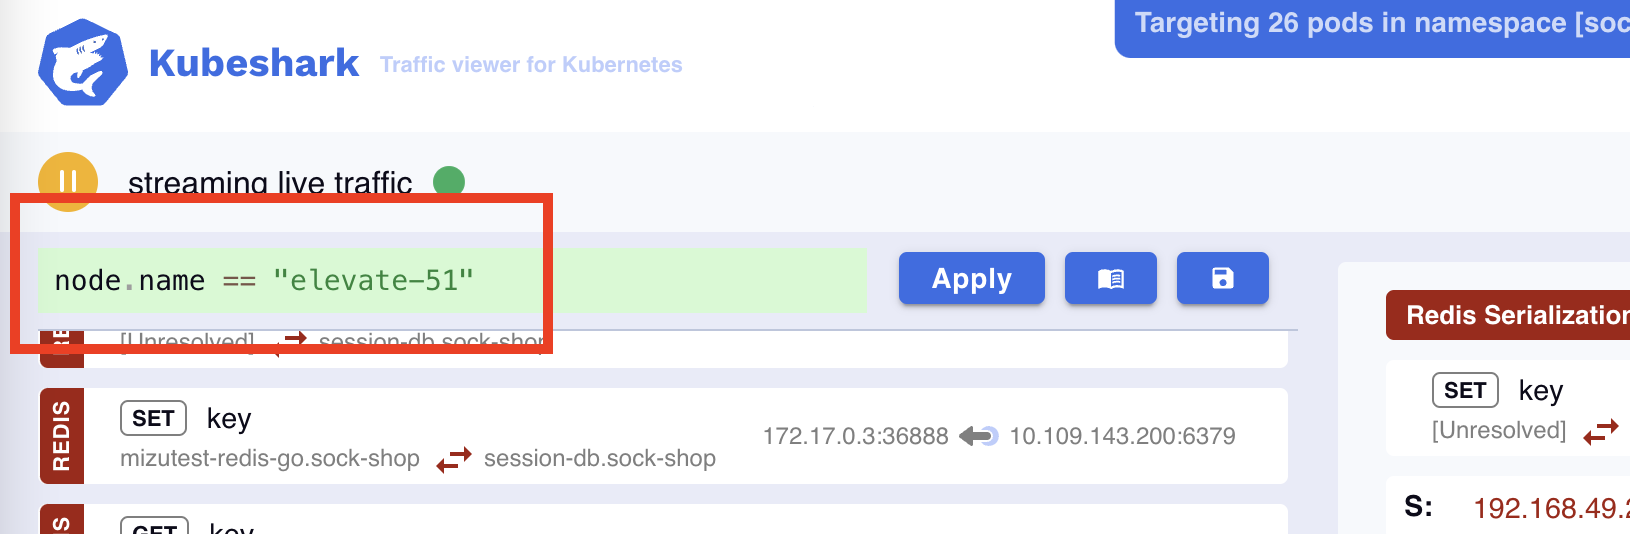
Focusing on a Certain Node
When you’d like to analyze the traffic at a specific node or set of nodes.
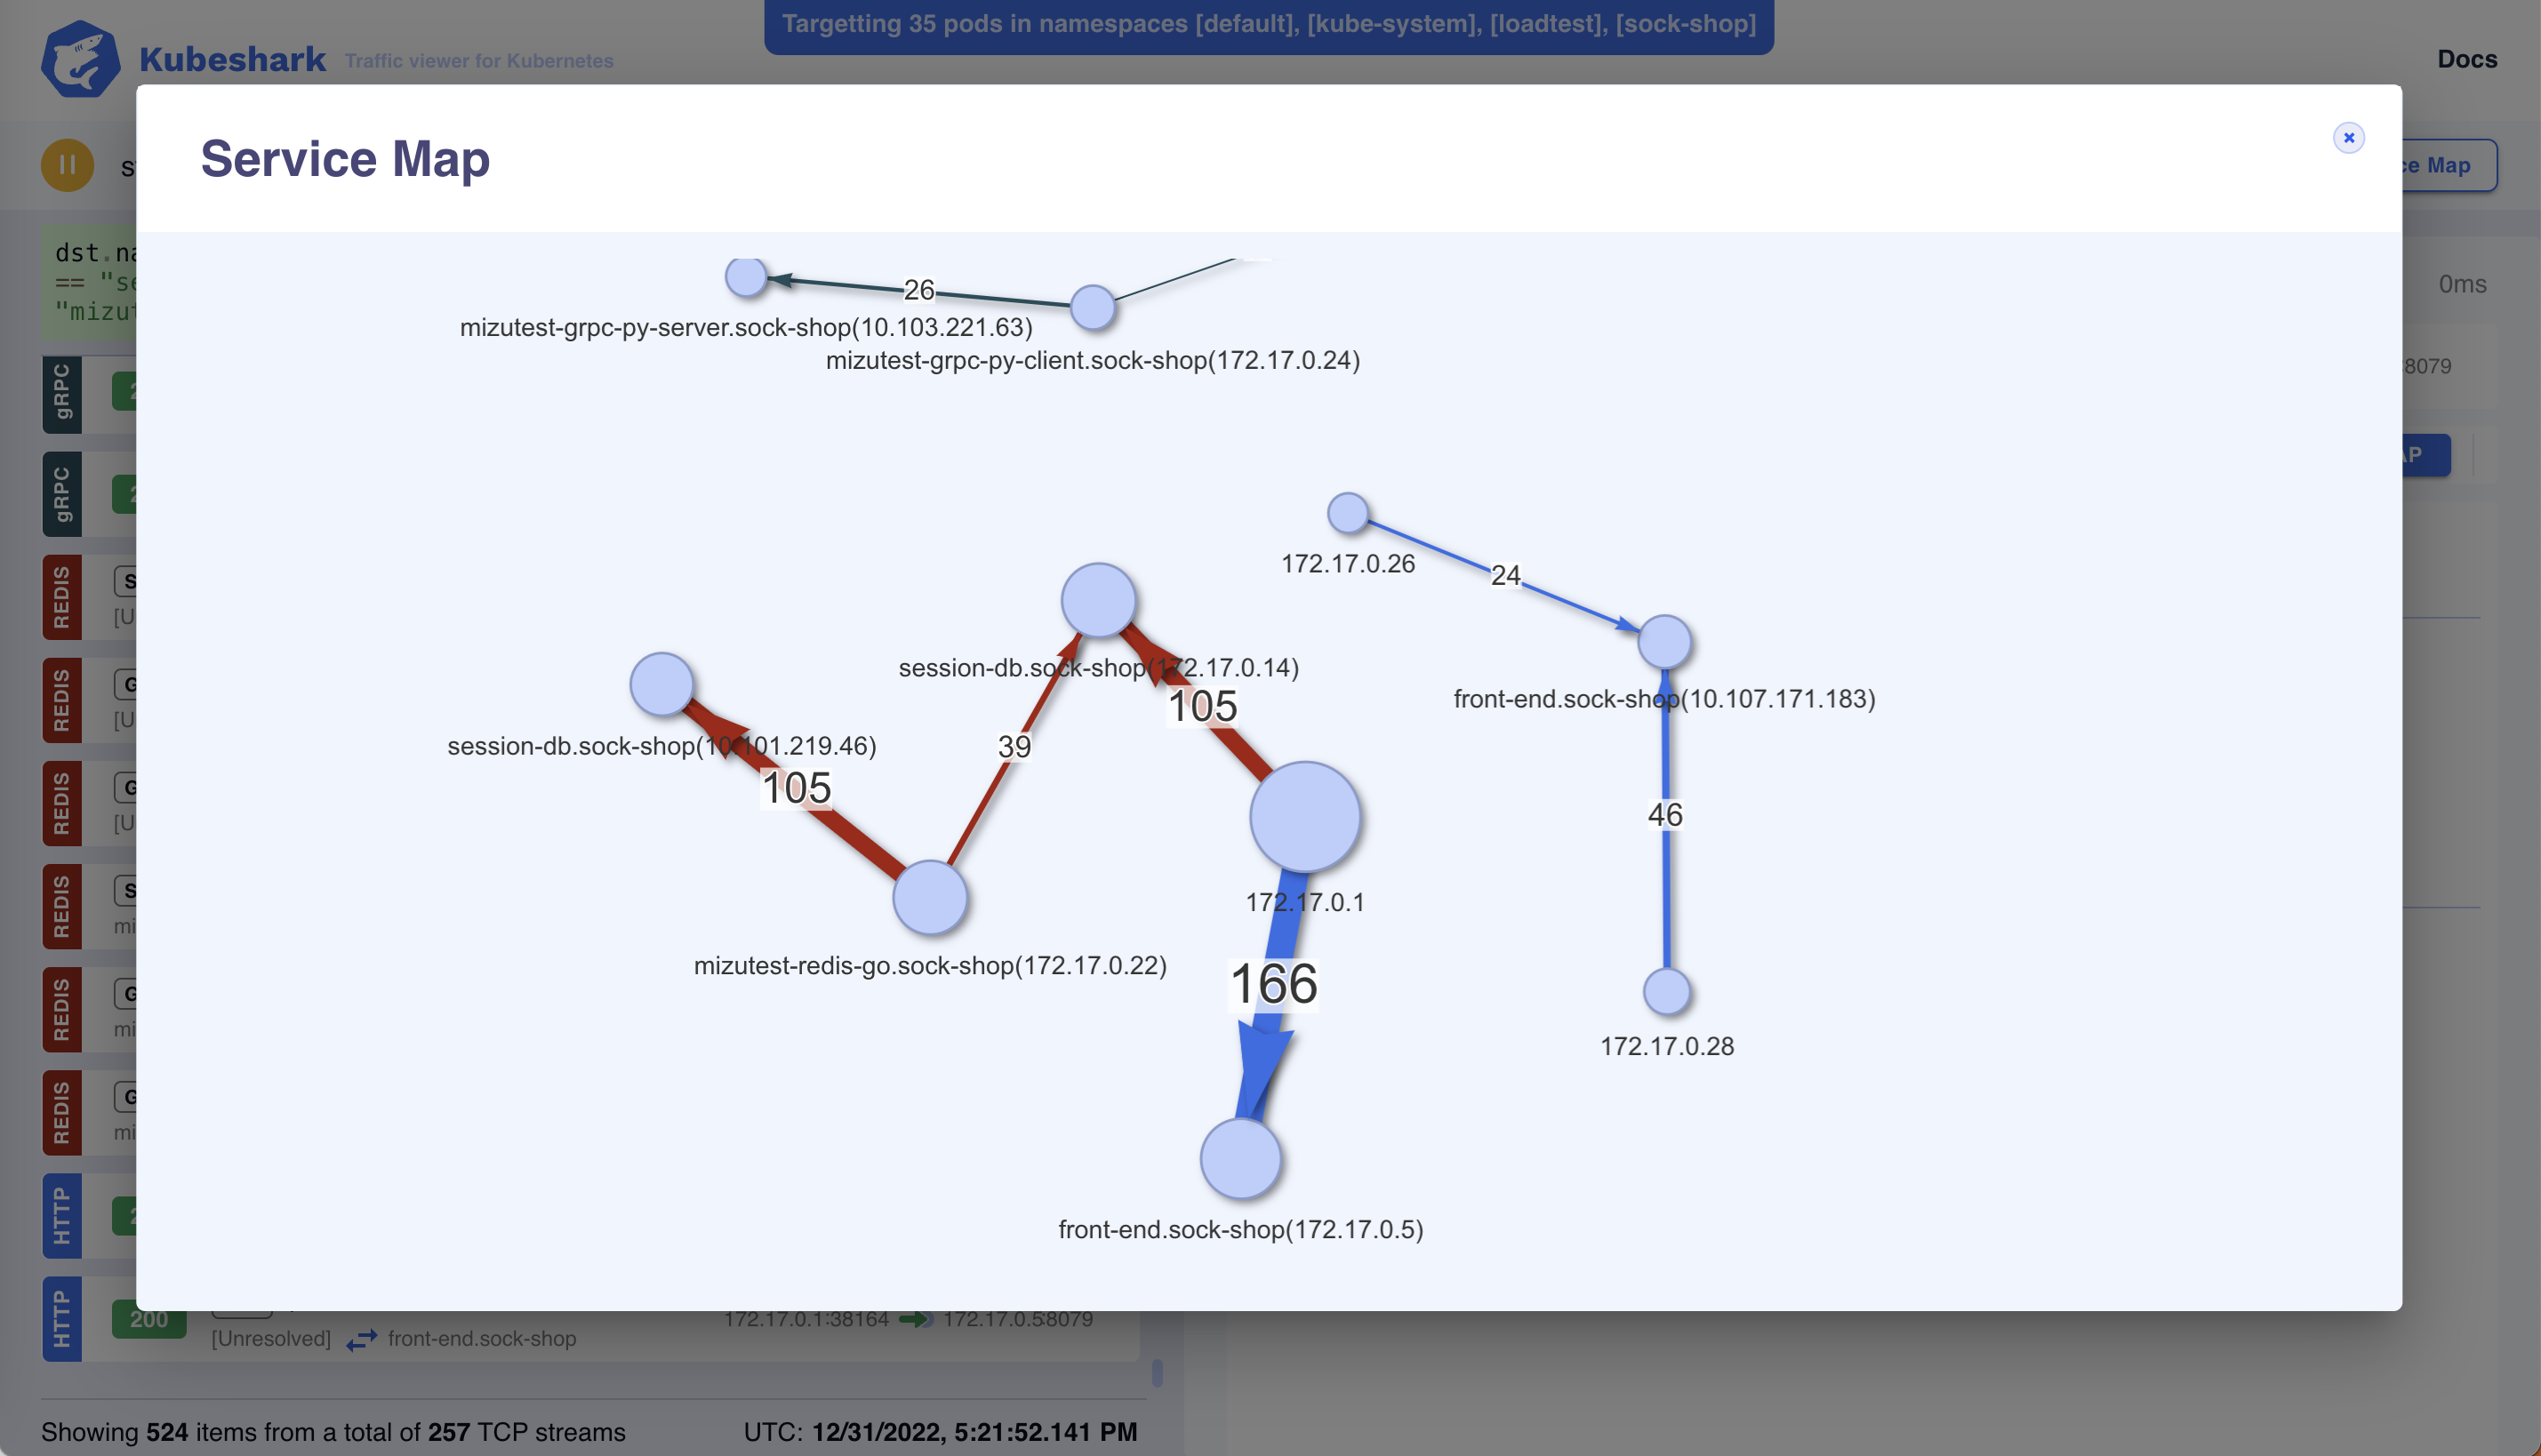
Identity-aware Service Map
Kubeshark offers an instant, identity-aware Service Map that updates in real-time, and can be used to focus your analysis on specific parts of the cluster.
In conjunction with its filtering language (KFL), Kubeshark enables you to focus on specific parts of your cluster and reduce the scope of analysis to only a subset of your cluster’s traffic.
For example, the following query will analyze the ingress traffic of two pods and the egress traffic of a third pod:
The resulting query will show the following service map: